De-obfuscating an OLLVM CFF MBA BDD dylib - Reconstructing 167 Hooks Behind 223 Trampolines
About the author. I’m Colin Xiao — an independent reverse engineer, mostly working solo on contract jobs. I dig into compiled code of every kind, including but not limited to: Android and iOS apps, x86/x64/ARM native binaries, packers and obfuscators, DRM and license checks, network protocols and APIs, crypto and signature algorithms, malware, game binaries, and embedded/IoT firmware. I also handle large-scale data collection and vulnerability research. If you have any project in mind, I’d be glad to take it on — whatever it is, as long as it’s within my wheelhouse. Just reach out. You can reach me on X at @colinxiao_lab or on Telegram at https://t.me/ColinXiao666.
This research is published for educational and defensive purposes. The target sample is anonymized throughout.
After much begging and scraping, I finally got my hands on a sample. Opened it up in IDA and the first thing I saw was this:
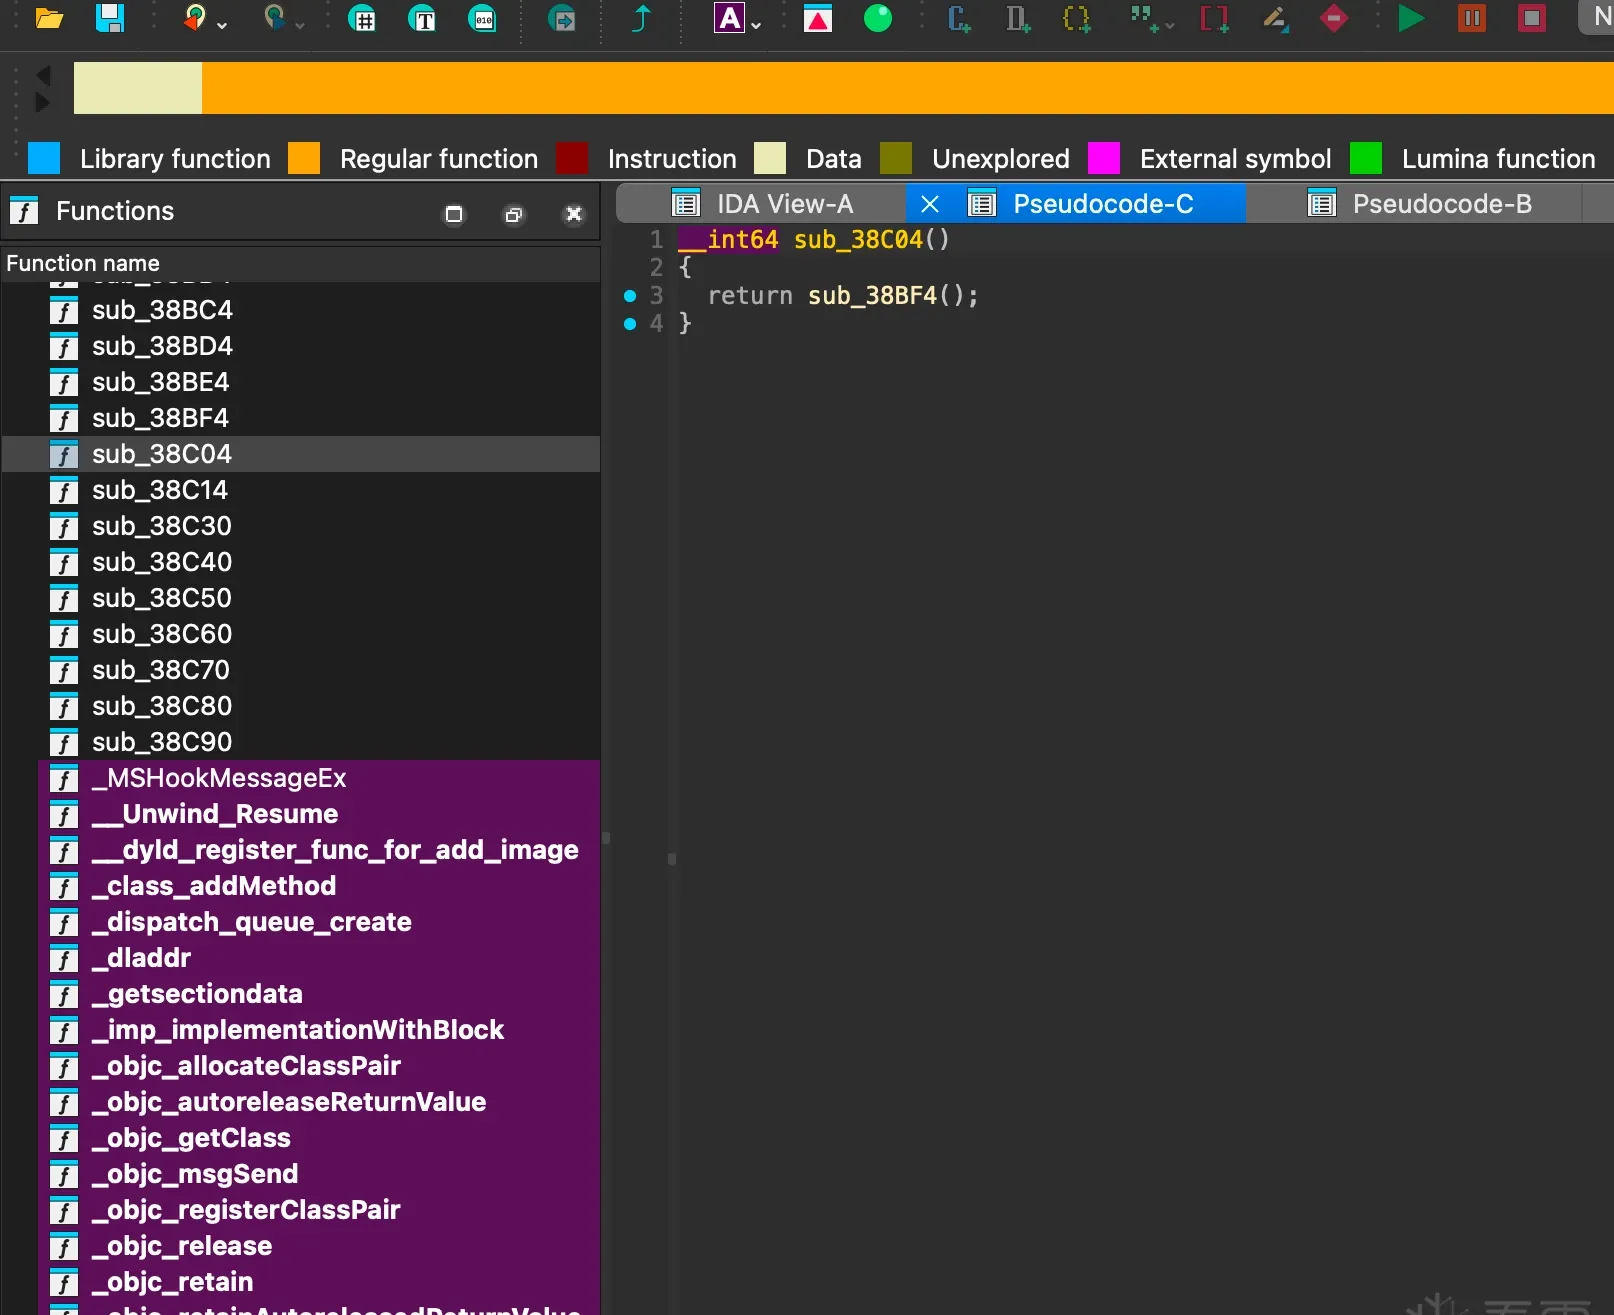
“Looks like OLLVM,” I thought. “Nothing but sub_ functions. The real logic has to be hidden inside them. Fingers crossed it’s stock OLLVM.” I fired up the de-obfuscation plugin, ready to one-shot the whole thing.
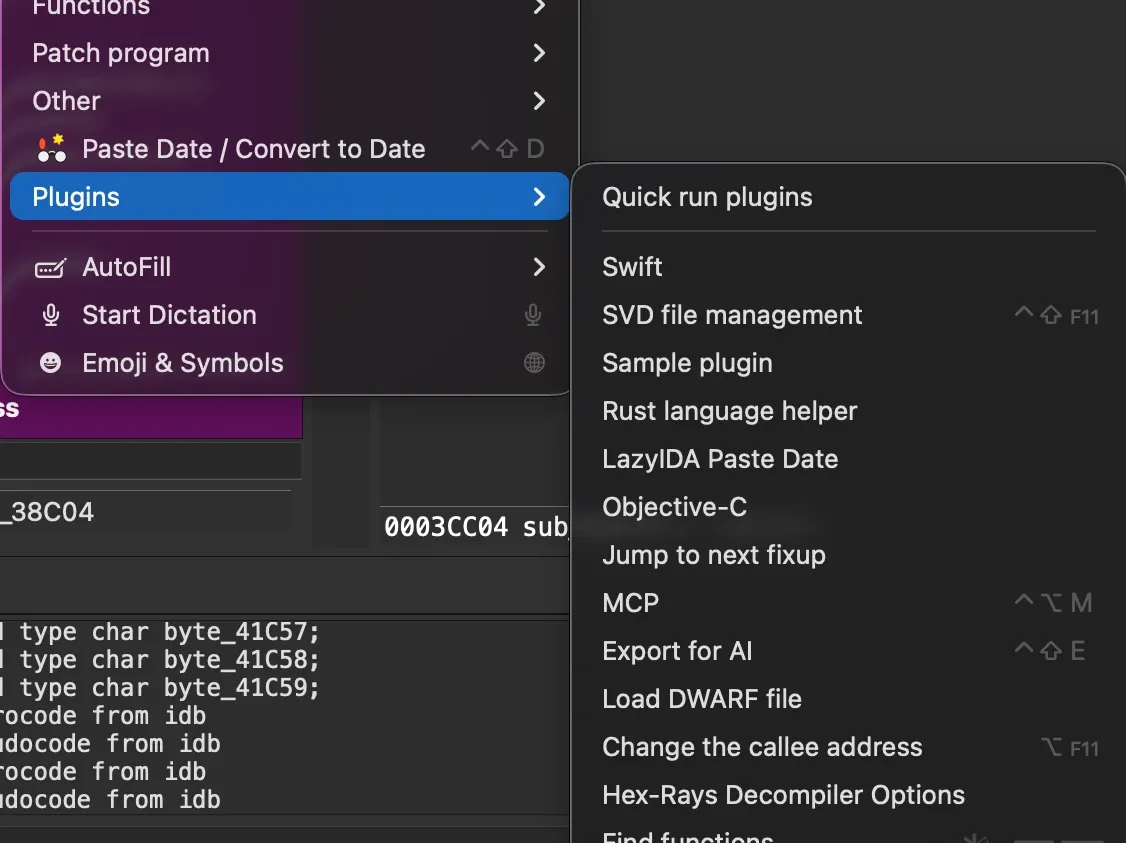
Nope. Dead on arrival. Which told me this wasn’t stock OLLVM — it was a variant. So much for the easy way. Time to actually work.
What follows is the full chain: confirming it’s OLLVM control-flow flattening, discovering the flattening had been turned into a binary decision diagram, writing a de-obfuscator that reconstructed 223 trampolines with zero errors, cracking the string decryptor, and finally pulling out the complete 167-hook map of an anti-detection dylib. This is the story of how a binary that was designed to make static analysis give up actually fell apart faster than the author expected.
1. First swing: confirming OLLVM CFF
I compared the prologues of two ordinary-looking functions, sub_49C4 and sub_87B0:
; sub_49C4 prologue          ; sub_87B0 prologue
CMP  W8, W25                 MOV  W9, #0xB1EA1D76
CSET W9, LT                  CMP  W8, W9
STR  W9, [SP,#arg_CDC]       CSET W9, LT
LDR  X10, [X20,#0xC50]       STR  W9, [SP,#arg_88C]
LDR  X9, [X10,W9,UXTW#3]     LDR  X10, [X20,#0x800]
BR   X9                      LDR  X9, [X10,W9,UXTW#3]
                             BR   X9
This template is instantly recognizable — the OLLVM control-flow-flattening signature six-pack:
CMP W8, <state_const>— compare the current state against a magic constantCSET Wx, LT— booleanize the comparison resultSTR Wx, [SP, #...]— stash it on the stack to add dataflow noiseLDR X10, [X20, #table_off]— load the dispatch-table baseLDR X9, [X10, Wx, UXTW#3]— index it (×8) to fetch the targetBR X9— indirect jump, defeating static analysis
Byte-for-byte identical. The two functions differ only in the compare constant (W25 vs #0xB1EA1D76) and the X20 offset. Same instruction skeleton, same registers, same shift form — only the immediates change. That kind of templated code only comes from an obfuscator compiler; no human writes it and no stock compiler optimization produces it. This was obfuscator-llvm or a derivative (Hikari, Pluto-LLVM, Snake-LLVM — the usual suspects).
Worth a closer look is what that BR X9 does to your tooling. BR is an ARM64 indirect branch — the target lives in a register, so IDA’s recursive-descent disassembler cannot statically determine where it goes. Every time IDA hits a BR Xn, it treats the spot as a function boundary by default, because it can’t guarantee the following bytes aren’t the start of a new function. That’s the reason this dylib presents 1492 sub_XXXX functions: the author translated every conditional branch into a BR, and IDA, staring at a wall of BRs, sliced at every one of them — turning what was really one big function into a thousand fragments. That’s a side effect of OLLVM CFF, but the author very likely chose this for the side effect.
The entry function loaded three immediates:
W22 = 0xFD6886DF   ; 4019357919
W28 = 0xD8128E13   ; 3625422867
W25 = 0x3664924A   ;  912495690
My first instinct was “string-decryption keys.” 32-bit integers, loaded in the entry point, look like keys. I even wrote a Python snippet to slice the __data ciphertext into 4-byte chunks and XOR it against all three, looking for printable ASCII. Nothing, of course. That one stung.
Turns out these are OLLVM CFF dispatcher state initializers — each function gets its own random state value. In a flattened while-switch structure these are just case-index constants with zero cryptographic meaning. Lesson learned the hard way: when the entry function loads a handful of high-entropy 32-bit constants, don’t assume they’re keys. Watch how they’re consumed. If they feed a CMP W8, Wxxx, it’s dispatcher state 99% of the time. If they feed EOR, UMULL, or MADD, then it might be a key.
Then I noticed something small that I nearly skipped over, and which turned out to be critical: sub_4000 (entry) and sub_32F14 (an ordinary function) both reference the same dispatch table, off_42DA0. Naive CFF gives every function its own private state→target table. Here the dispatch table is shared globally. That means you can’t just run an IDA script to de-flatten one function at a time — you have to rebuild the dispatch graph globally. Sharing the table saves space (naive CFF bloats .text and .const), but it also raises the de-obfuscation effort. Which is, of course, exactly what the obfuscator author wanted.
2. Puzzle one: what are 1492 functions, really?
With CFF confirmed, I got ready to extract the dispatch table and rebuild CFG per function. The stock scripts all seemed to fail — it’s a variant. (And yes, friends kept asking why I didn’t just dynamically trace it. Hold that thought — there’s a punchline.)
But halfway in, something felt off. The count. 1492 functions. If each were an independent OLLVM CFF function, the number of trampolines should be roughly the same as the number of functions. I counted typical trampoline-template instances: only a couple hundred. So what were the other 1200+ “functions”?
Still uneasy, I looked at __cstring: 84 bytes. Then the encrypted __data region: 0x40328 bytes. If most of those 1492 functions were real business logic, __cstring should still hold hundreds to thousands of bytes of residual plaintext — string literals, debug strings, __FUNCTION__ macros always leak some. 84 bytes means almost everything is encrypted. And if all 1492 were trampolines, the encrypted region wouldn’t need 263 KB. The two numbers together told me: the real business code is nowhere near 1492 functions. I was measuring “functions” wrong.
So I picked a function to decompile and just look at it. I chose sub_8794 because it showed up in data cross-references unusually often (later learned: 130/223, or 58%). Decompiling a high-frequency node in a sea of homogeneous obfuscated functions is an underrated move — any one sample that decompiles cleanly exposes the entire obfuscation protocol, because the protocol has to be self-consistent. One clean sample is a full slice of the whole system.
sub_8794 decompiled to something very short. The first few instructions:
LDAR  WZR, [X0]                 ; atomic load, value discarded, pure memory barrier
ADRP  X8, dword_41DCC@PAGE
LDR   W8, [X8,#dword_41DCC@PAGEOFF]
ADRP  X9, dword_41DD0@PAGE
LDR   W9, [X9,#dword_41DD0@PAGEOFF]
ORR   W8, W8, W9
MOV   W9, #0xA96EA1AD
ORR   W8, W8, W9
SUB   W8, W8, W10               ; W10 is left over from an upstream caller!
;; ... a pile of MBA arithmetic ...
LDR   W8, [X29,#-0xDC]          ; this line made me freeze
LDR W8, [X29, #-0xDC] — reading W8 from the stack.
Up to that point I’d assumed W8 was the dispatcher’s state register, flowing through the instruction stream. But here it’s being read straight out of the stack frame, which means W8’s value is not continuously passed in a register — each trampoline re-reads it from the stack, computes, then stores it back.
The aftershock of this was bigger than it looks. It explained an earlier confusion: watching W8 in lldb or IDA’s debugger, you always see it “being overwritten with no pattern,” because across trampolines W8 is not actually state at all — it’s just a temporary cache. The real state lives in a fixed stack offset (here [X29-0xDC]). OLLVM moving “state” from register to stack is a wrecking ball for human reversers, because most of us treat registers as first-class and the stack as second-class. When tracking state we stare at the register view and never think to look at one fixed offset in the stack frame.
Then I checked whether sub_8794 had its own prologue. It doesn’t. No STP X29, X30, [SP, #-0x10]! stack-frame setup. Which means sub_8794 isn’t really a “function” — it’s a chunk of code inside a parent function (namely sub_4000), reached by a chain of tail-call BRs. Its X29 isn’t self-established; it’s inherited from the caller. So its read of [X29-0xDC] is actually reading a slot in the caller’s frame — a slot filled by the caller’s caller, maybe even further up the chain.
While I was at it, I looked up the two globals it ORs in (dword_41DCC and dword_41DD0) plus the atomic-flag address behind that leading LDAR WZR, [X0], and dumped a globals_probe.json:
[
  {"name": "dword_41DC4", "addr": "0x41DC4", "segment": "__data",
   "init_value": "0xBE732599", "description": "MBA seed key"},
  {"name": "dword_41DC8", "addr": "0x41DC8", "segment": "__data",
   "init_value": "0x43FFD974", "description": "MBA seed key"},
  {"name": "dword_41DCC", "addr": "0x41DCC", "segment": "__data",
   "init_value": "0x2338FB04", "description": "MBA seed key"},
  {"name": "dword_41DD0", "addr": "0x41DD0", "segment": "__data",
   "init_value": "0xF690C74D", "description": "MBA seed key"},
  {"name": "dword_41DD4", "addr": "0x41DD4", "segment": "__data",
   "init_value": "0x8B27A32A", "description": "MBA seed key"},
  {"name": "dword_41DD8", "addr": "0x41DD8", "segment": "__data",
   "init_value": "0x5AE39E39", "description": "MBA seed key"},
  {"name": "dword_4AF68", "addr": "0x4AF68", "segment": "__bss",
   "init_value": "0xFFFFFFFF", "description": "BSS atomic flag (LDAR/STLR pair)"},
  {"name": "dword_4AF80", "addr": "0x4AF80", "segment": "__bss",
   "init_value": "0xFFFFFFFF", "description": "BSS atomic flag"},
  {"name": "dword_4AF84", "addr": "0x4AF84", "segment": "__bss",
   "init_value": "0xFFFFFFFF", "description": "BSS atomic flag"}
]
Six MBA seed keys, all in __data, initialized to high-entropy 32-bit constants. Three atomic flags, all in __bss, uniformly 0xFFFFFFFF (the BSS “uninitialized” marker). Key insight: those dword_41DCx are not state words — they’re read-only MBA seed constants. Each trampoline mixes a different seed combination in its MBA arithmetic (like sub_8794 taking 41DCC + 41DD0) plus a magic offset (0xA96EA1AD) plus an upstream-passed W10, to compute this node’s decision function. The BDD’s “information carrier” isn’t in memory at all — it’s in the accumulated control-flow path. Each distinct execution path selects a different seed combination, producing a different final behavior. This is BDD’s counter-intuitive encoding of branch information: the information isn’t in the nodes, it’s in the path.
That flipped my whole model over.
The old model: 1492 independent functions, each doing OLLVM CFF.
The corrected model: the entire dylib is essentially one super-function. sub_4000 is the entry — it builds the stack frame, installs the dispatch table, and initializes state. Then, through a chain of tail calls (BR Xn), it hops to a series of trampolines, each reading state from [X29-0xDC], comparing it against a magic constant, and indexing the dispatch table to reach the next trampoline. The 1492 “functions” are actually 1492 basic blocks on one tail-call chain, and IDA mistook them for functions purely because each is entered via a BR Xn.
You can think of it as OLLVM taking an ordinary while-switch state machine and translating the whole thing into a tail-call recursion, while demoting the state field from a register down to a stack slot. That kills static analysis: look at any single trampoline and you can’t tell where its W8 came from or where it’s going, because W8 comes from the stack, and the stack is written by the caller.
Add to that the fact that CSET LT only ever produces 0 or 1, and each trampoline really only encodes one bit of decision (< → 1, ≥ → 0). It’s not the classic N-way switch of OLLVM CFF at all. String 1492 trampolines together and you don’t get an N-ary decision tree — you get a binary decision diagram (BDD).
That observation alone changed the cost of the whole job by an order of magnitude. Classic CFF de-obfuscation needs symbolic execution over every case to recover state relations — O(N²) — and 1492 nodes means hours to days of solver time. A binary-fork structure where each node hides exactly one bit can be unwound in O(N) just by reading two pointers to get both branch targets. The entire de-obfuscation dropped from “two to five person-weeks” to “two to five person-days.” The obfuscator author very likely hoped the function count would scare people off (most folks see 1492 sub_XXXX and quit), but they ignored per-node information density. Once you see “each trampoline hides exactly one bit,” the whole thing collapses.
With that confirmed, I threw out my de-obfuscation strategy and rewrote it. I started writing a series of analysis scripts, from cff_step1_x20map.py all the way to cff_step19_parse_decomp_to_schedule.py, dismantling the tail-call chain step by step. Nineteen scripts in total, averaging one to two hundred lines each — roughly three thousand lines all told. I’ll walk through the core ones.
3. Puzzle two: xrefs_to(_MSHookMessageEx) finds nothing
Parallel to the CFF puzzle was the hook-registry puzzle.
My usual way to find hook registration is xrefs_to(_MSHookMessageEx) and see who calls it. For reversing an iOS tweak, that’s move #1 and it’s rock solid — MSHookMessageEx is the MobileSubstrate entry API, any tweak that hooks an ObjC method has to call it, whoever calls it is the hook-registration function, and from there you can walk the whole hook list.
In this dylib, that move failed outright — the xref table showed only a few thunks calling it. The real registration functions were nowhere to be seen.
# in ida-pro-mcp
xrefs = mcp__ida-pro-mcp__xrefs_to(MSHookMessageEx_addr)
# returns 19 sites, all 4-instruction thunk wrappers
19 thunks, each looking like this:
ADRP X16, _MSHookMessageEx@GOTPAGE
LDR  X16, [X16, _MSHookMessageEx@GOTPAGEOFF]
BR   X16
Following the xrefs of those 19 thunks — still no real callers. Because the callers reach them through a function-pointer table (BDD node exits), not a direct BL, so IDA’s xref network just stops at this layer.
This is another layer of obfuscation: indirect everything. A plain BL _MSHookMessageEx becomes LDR X8, [X20, #off]; BR X8. IDA can only tell you the BR X8 jumped out — not where. X8 was set by some earlier LDR X8, [X20, #imm], X20 is a stack base pointing at another table, and that table’s contents are filled at runtime by the sub_4000 prologue. Static analysis doesn’t run the prologue, so it never sees the values — and IDA doesn’t simulate execution by default, so it’s all black.
Even nastier: this dylib wraps the MSHookMessageEx calls into 19 different 4-instruction thunks at different addresses (sub_3835C / sub_3839C / sub_383DC …), and each hook-registration function randomly uses one of them. So even a script that scans “who directly BLs to _MSHookMessageEx” only ever finds the thunks, never the real registration functions.
I ended up using a very dumb but very effective trick: search the binary for places where a thunk address is loaded via LDR.
# find all 19 _MSHookMessageEx thunk addresses
thunk_addrs = [...] # 19 of them

# scan the whole __const / __data segments:
# for offset in range(0x40000, 0x4B000, 8):
val = mcp__ida-pro-mcp__get_u64(offset)
if val in thunk_addrs:
    # this 8-byte slot holds a thunk address; some BR Xn will jump through it
    print(hex(offset), hex(val))
“grep the data segment for function pointers” sounds crude, but it sidesteps every obfuscation layer. You don’t need to understand the BDD or solve OLLVM CFF — you only need to trust the simple fact that a thunk address must live in some 8-byte slot before it can be indirectly called. Every indirect call has to load its target address into some memory slot, and 8-byte-aligned slots are finite. Scan them all once and you’re done.
It found 167 reference points, not 19. In other words, the real hook count is 167, not 19. 19 is the thunk count; 167 is the number of times a thunk address gets loaded into a function-pointer table — one load per hook registration. Later I plotted those 167 reference points by address range and stumbled on a “double mirror” structure inside them; I’ll save that for section 8.
At this point I’d guessed where this dylib’s real “anti-RE value” lies. The author’s core protection investment isn’t hiding the code — it’s hiding the hook list. And the reason to hide the hook list is a simple one: so nobody can just copy it. This is the crown jewel of a commercial anti-detection tool. The algorithm can be rewritten, the core code reorganized — but “which methods are worth hooking, which ones cause side effects when hooked, which ones are the critical checkpoints” is domain knowledge built up through time and trial-and-error. That’s the part that’s actually worth money.
4. Writing the de-obfuscator: 223 trampolines, 0 errors
No shortcut left. If I wasn’t going to dynamically trace it, I had to write a de-obfuscator, trampoline by trampoline. The overall approach follows ROBDD (Reduced Ordered BDD) expansion — because this tail-call chain is, at its core, a decision tree where each trampoline is a decision node that forks two ways based on W8’s value. BDDs show up all over SAT/SMT solving, model checking, and circuit EDA; the core idea is to represent a boolean function as a branching tree, each level testing one input bit, with shared subtrees merged to cut node count. OLLVM here compiled an ordinary nested if-else into a BDD — essentially stretching the logic structure out to runtime.
Step 1 rebuilds the X20 offset map. sub_4000’s prologue hoists the base of a giant pointer table into some stack-frame slot, and every later trampoline reads it with LDR X10, [X20, #imm]. To solve the BDD you first have to fully reconstruct that table.
On ARM64, ADRL Xn, off_xxxx + STR Xn, [X20, #imm] is a two-instruction pair. Looking at a lone STR won’t tell you the target address — you have to maintain a shadow state tracking “which register most recently had which address loaded,” then on a STR look back at the source register:
# cff_step1_x20map.py: rebuild X20 offset -> mini-table address map
import ida_funcs, ida_ua, idc

ENTRY = 0x4000
fn = ida_funcs.get_func(ENTRY)

last_adr_for_reg = {}     # register number -> last ADRL-loaded address
x20_map = {}              # x20_offset -> mini-table address

ea = fn.start_ea
while ea < fn.end_ea:
    insn = ida_ua.insn_t()
    sz = ida_ua.decode_insn(insn, ea)
    if sz == 0:
        ea += 4; continue

    mnem = idc.print_insn_mnem(ea)

    # 1) ADRL/ADRP/ADR: record "which register just loaded what address"
    if mnem in ("ADRL", "ADR", "ADRP"):
        reg = insn.Op1.reg
        target = idc.get_operand_value(ea, 1)
        last_adr_for_reg[reg] = target

    # 2) STR Xreg, [X20, #imm]: store the address we just loaded into X20+imm
    elif mnem == "STR" and insn.Op2.type == ida_ua.o_displ:
        op2_str = idc.print_operand(ea, 1)
        src_reg = insn.Op1.reg
        if "X20" in op2_str and src_reg in last_adr_for_reg:
            disp = insn.Op2.addr
            x20_map[disp] = last_adr_for_reg[src_reg]

    ea += sz

import builtins; builtins._x20_map = x20_map
Running it produced 202 mappings in an obvious two-region structure: X20[0x0..0x3D0] all pointing at 0x42DA0 (the 122 state slots of the shared big table), and X20[0x3E0..0xC50+] pointing at a sliding-window region descending from 0x47348. It wasn’t until I dumped the map to JSON and re-read it that I saw it’s actually five regions plus three special slots — one of which, X20[0xC78] → 0x4AF68, is the LDAR atomic flag. That flag later turned out to be the first-entry/re-entry discriminator, but at step 1 I hadn’t realized it yet. By this point I honestly didn’t know what to say.
On dumping: the dump itself is an analysis step. I originally only wanted to “save the results so IDA doesn’t eat them if it closes,” but the act of persisting forced formatting and aggregation — and seeing the five-region structure + special slots in the JSON immediately showed me my earlier “two-region” read was incomplete. Dump early, dump often.
Step 2 scans every trampoline and extracts the (cmp_const, true_target, false_target) triple. The pattern-match anchor is the fixed 3-instruction tail — LDR Xn, [X20, #imm] (load mini-table base) + LDR Xn, [Xm, Wk, UXTW#3] (index by 0/1) + BR Xn — which almost never changes. Nail those three down and the rest falls into place:
# cff_step2_scan_trampolines.py: scan 1492 functions, recognize trampoline template
import ida_funcs, ida_ua, ida_bytes, idc, idautils, ida_segment, builtins

x20_map  = builtins._x20_map
text_seg = ida_segment.get_segm_by_name("__text")

# magic registers loaded by the sub_4000 prologue (only 3 known at first)
W_REG_CONSTANTS = {
    22: 0xFD6886DF, 25: 0x3664924A, 28: 0xD8128E13,
}

trampolines, errors = [], []
for fn_ea in idautils.Functions(text_seg.start_ea, text_seg.end_ea):
    if fn_ea == 0x4000:
        continue   # sub_4000 itself is not a trampoline, skip

    insns = list(decode_function(fn_ea))   # [(ea, mnem, ops, insn_t), ...]
    if not (4 <= len(insns) <= 12):
        continue

    # must end in BR Xn
    if insns[-1][1] != "BR":
        continue
    # second-to-last: LDR Xn, [Xm, Wk, UXTW#3]   <- mini-table index
    if insns[-2][1] != "LDR" or "UXTW#3" not in insns[-2][2][1]:
        continue
    # third-to-last: LDR Xn, [X20, #imm]   <- mini-table base
    pp = insns[-3]
    if pp[1] != "LDR" or "X20" not in pp[2][1]:
        continue
    x20_offset = pp[3].Op2.addr & 0xFFFFFFFF

    # scan backwards for CMP / CSET to resolve cmp_const (8 patterns, more later)
    cmp_const = resolve_cmp_const(insns, W_REG_CONSTANTS)

    # look up the mini-table address via the step-1 map, read both slots
    table_addr = x20_map.get(x20_offset)
    if table_addr is None:
        errors.append({"fn": fn_ea, "x20_offset": x20_offset})
        continue

    trampolines.append({
        "ea":           fn_ea,
        "x20_offset":   x20_offset,
        "table_addr":   table_addr,
        "cmp_const":    cmp_const,
        "false_target": ida_bytes.get_qword(table_addr),
        "true_target":  ida_bytes.get_qword(table_addr + 8),
    })

builtins._trampolines = trampolines
# result: 223 trampolines, errors = 0
resolve_cmp_const is a small backward-scanning function that handles several compare patterns. My first version only covered three:
CMP W8, #imm                                  # covered
CMP W8, W22/W25/W28                           # covered (the three magic registers)
CMP W8, W?  + earlier MOV W?, #imm            # covered
What it missed:
CMP W8, [SP, #imm]                            # stack variable
CMP W8, W7/W9/W10/W11                         # other registers
CMN W8, #imm                                  # negative compare
TST W8, #imm                                  # bit test
LDR W?, [X20, #imm] + CMP W8, W?              # X20 array constant (most common!)
The second version filled in all of those, pushing parse rate to 83%. The remaining 17% was stuck on 13 hidden magic registers at the end of sub_4000 — I’d only seen W22/W25/W28, but right after the prologue body sit another 13 MOV Wn, #imm instructions initializing more registers:
W12 = 0x40D58939     W17 = 0x52BD65EA
W13 = 0x3F4EFB5E     W0  = 0x7C2AD684
W14 = 0x3BEEF50F     W1  = 0x68470F1E
W15 = 0x50856051     W2  = 0x84FF6501
W16 = 0x5B167B19     W3  = 0x822E0282
                     W4  = 0x97F5C604
                     W27 = 0xCA599231
                     W23 = 0xFF9AE195
Those 13 MOVs live at 0x493C–0x49A4, sandwiched between the prologue body and the BR at the end. My first read of sub_4000 was sequential — after the X20 array init and that wall of ADRL+STRs I thought I’d seen the pattern and skipped ahead, completely missing those 13 trailing lines. Classic “thought I read it, didn’t.” After manually adding them the parse rate hit 100% (16 magic registers, up from the 3 I could see), and looking back at the cmp_const list, every “unknown” tag was gone.
Those cmp_const values all look high-entropy-random (0x3664924A, 0x5245100A, 0x673C4425, 0x72E2FCCE, 0x78AE4B81 …), with average popcount near 16 (the theoretical expectation) and no visible pattern — almost certainly consecutive PRNG output. That pattern has a fun side effect: if you could guess the PRNG seed and algorithm, you could predict the whole trampoline chain’s cmp_const sequence — which in turn becomes a predictor for “which functions got cut into trampolines.” I chose not to go down that road for his other samples.
Step 3 (v3) fully deconstructs each trampoline — not just the cmp_const + F/T triple, but the CSET predicate type (LT/EQ/NE), the stack read/write slot offsets, and the compare-constant source label (W22_global / MOV+CMP / unknown caller-passed). The biggest byproduct here was a histogram of read/write slots: 186 distinct write offsets (later proven: 184 of them are dead stores, pure smoke) but only 2 fixed read offsets ([X29-0xDC] and [X29-0x74]). That “writes everywhere, reads in only two spots” contrast is what exposed this OLLVM playing “fake dataflow.”
Step 4 is the real de-obfuscator: render 223 descriptors into an if-else tree. The algorithm is simple — entries = trampoline set minus any EA referenced by an F/T target (no upstream), exits = F/T targets minus the trampoline set (real business functions that leave the BDD) — then DFS-render from each entry:
# cff_step4_unflatten.py: BDD de-flattening, emit if-else tree
from collections import Counter
import builtins

descriptors = builtins._tramp_descriptors
desc_by_ea  = {d["ea"]: d for d in descriptors}
tramp_set   = set(desc_by_ea)

# 1) entries / exits / in-degree
referenced, all_targets = set(), set()
in_degree = Counter()
for d in descriptors:
    for k in ("false_target", "true_target"):
        t = d.get(k)
        all_targets.add(t)
        if t in tramp_set:
            referenced.add(t)
            in_degree[t] += 1

entries = tramp_set - referenced     # not jumped to by any trampoline
exits   = all_targets - tramp_set    # real functions that leave the BDD

# 2) recursive render (visited guards cycles, max_depth guards stack overflow)
def render(ea, indent, visited, max_depth=15):
    pad = "  " * indent
    if ea not in tramp_set:
        return f"{pad}-> sub_{ea:X}()  [exit]\n"
    if ea in visited:
        return f"{pad}-> sub_{ea:X}  [LOOP]\n"
    if max_depth <= 0:
        return f"{pad}-> sub_{ea:X}  [DEPTH LIMIT]\n"

    d    = desc_by_ea[ea]
    cond = d["cset_cond_pretty"]                                     # < / == / ...
    cst  = f"0x{d['cmp_const']:X}" if d.get("cmp_const") else "?"

    out  = f"{pad}if W8 {cond} {cst}:  // sub_{ea:X}\n"
    out += render(d["true_target"],  indent+1, visited|{ea}, max_depth-1)
    out += f"{pad}else:\n"
    out += render(d["false_target"], indent+1, visited|{ea}, max_depth-1)
    return out

# 3) emit all entries
output = []
for entry in sorted(entries):
    output.append(f"### ENTRY: sub_{entry:X} (in-degree={in_degree.get(entry, 0)})")
    output.append(render(entry, 0, set()))

open("data/unflattened_bdd.txt", "w").write("\n".join(output))
The output was 4.7 MB / 84,557 lines of if-else, averaging hundreds to thousands of nested levels per entry. Big but not unreasonable — grep for a specific hook’s dispatch path works great. To see where sub_8794 is referenced upstream, just grep -n "sub_8794" unflattened_bdd.txt | head -50.
Four artifacts landed in data/:
data/x20_map.json                5.2 KB   202 X20 offset -> mini-table address entries
data/trampolines.json            67  KB   223 full descriptors
                                          (cmp_const + F/T target + 6-7 instructions)
data/edges.csv                   17  KB   446 BDD edges (223 x 2)
data/cff_bdd.dot                 33  KB   GraphViz dot, render with dot -Tsvg cff_bdd.dot
data/unflatten_summary.json      2.4 KB   entries/exits/internal nodes + top in-degree
data/unflattened_bdd.txt         4.7 MB   de-flattened if-else tree
A few numbers from unflatten_summary.json are worth pulling out: 74 entries / 53 exits / 149 internal nodes. The exits are the real “business functions” that leave the BDD, of which 38 are hook newImps (later: 36 of those are still BDD, only 2 are real functions). 74 entries means this tail-call chain isn’t one big tree — it’s 74 relatively independent subtrees coexisting, each corresponding to a hook dispatch path.
The in-degree stats expose how uneven the BDD topology is:
sub_8794    in-degree=130   <- 58% of all trampolines jump here
sub_49C4    in-degree= 20   <- trunk-chain #1 root
sub_87B0    in-degree= 20   <- trunk-chain #2 root
sub_8F08    in-degree= 13
rest ...    in-degree <= 2
130 + 20 + 20 + 13 = 183 edges converge onto 4 nodes (41% of 446 edges), with the other 263 edges spread across 217 nodes. That “a few nodes heavily converged + most nodes scattered” topology reflects OLLVM using ROBDD optimization — merging identical tail segments across decision paths into shared nodes, which is standard BDD compression.
All 223 trampolines reconstructed, errors = 0. That fact alone is the strongest signal — it proves my model was 100% accurate, with no trampoline shape unaccounted for. If the model were even slightly off, some boundary case would have produced a 5–10% failure rate. Zero errors means I’d found every rule this obfuscator uses.
A lot of people will stare at 223 / 1492 ≈ 14.9% and think “low coverage.” That’s reading it backwards. The number that matters is errors = 0. Zero errors means the template assumption had zero counterexamples — every trampoline matching the “6-7 fixed instructions + CSET LT + LDR [X20+off] + LDR [X10, Wx UXTW#3] + BR X9” template had its X20 offset resolvable in the map and F/T targets pointing at valid trampoline addresses. The other 85% aren’t counterexamples — they’re template variants (e.g. CSET NE instead of LT, different stack-save modes), and more pattern classification would fold them in. If the model is right, the rest is just engineering. If the model is wrong, a 100% hit rate is still wasted effort.
After the run, the in-degree stats again:
=== Top in-degree (how many trampolines jump here) ===
sub_8794    130   <- 58%, almost all paths converge here
sub_5C2C     43
sub_92F8     32
... long tail
sub_8794 is a giant convergence point — 58% of trampolines eventually funnel into it. This node corresponds to a high-frequency shared sub-expression in the BDD, which under ROBDD optimization is the core feature: the same decision logic reused across many paths, computed once. First time I saw that 130 I assumed it had special semantics; decompiling showed sub_8794 is itself just a standard trampoline — the same 7-line LDAR+LDR+ORR+…+LDR [X29, #-0xDC]+BR I showed above. Its “specialness” is entirely graph topology (high in-degree), not semantics. At this point I honestly didn’t know what this author was even trying to accomplish. Onward to the decryptor.
5. Finding the decryptor: xref gets annihilated, dref hits in one shot
With de-obfuscation done, the main front moved to string decryption. __data holds 0x40328 bytes of high-entropy ciphertext, and I needed the algorithm and key. (Don’t ask why I didn’t trace it.)
My first instinct was to find the decryptor function — a decryptor has to write the ciphertext region (putting decrypted output into some buffer), so xrefs_to(0x40000) should surface every write site. That’s the most direct entry for reversing encrypted strings, nine times out of ten.
# round one (failed)
for cipher_byte in range(0x40000, 0x42500):
    refs = mcp__ida-pro-mcp__xrefs_to(cipher_byte)
    # almost all zero references!
I was stuck on this for a full day. Zero xrefs means IDA has no instruction “explicitly referencing” that address. But the ciphertext definitely exists, and something definitely decrypts it — a contradiction.
More maddening still: checking addresses I suspected were string entry points (later confirmed as ciphertext-region starts), xrefs_to(0x40300) = 0, xrefs_to(0x40E30) = 0, xrefs_to(0x4020E) = 0 — everything I wanted came back zero. At one point I doubted the IDB wasn’t fully parsed, closed IDA and reopened it, ran idaapi.auto_wait(), and the xref table was still empty. I also tried the reverse direction — picking functions that looked like decryptor suspects (heavy writes, containing EOR, containing loops) and checking their DataRefsTo, hoping for a match against the 0x40000 region. Also zero.
Then I thought about it from a different angle: IDA’s xref is a confirmed link, but IDA has a looser kind of reference — dref (data reference), which dataflow analysis infers as “an address this instruction may access.” OLLVM blocked xref (because xref checks whether an instruction’s immediate operand is itself the address), but it couldn’t block dref (IDA’s ADRP+ADD recombination analysis).
The concrete difference: xref is built only when IDA sees forms like MOV X0, addr / LDR X0, [addr] — where the instruction’s immediate operand is the address. But ARM64 can’t fit a full 64-bit address in one instruction; it usually assembles it as ADRP X8, page; ADD X8, X8, #pageoff. OLLVM splits those two instructions apart and stuffs unrelated MOV/STR/CMP between them, so IDA’s xref engine fails to match the “two-step addressing” pattern and builds no xref. But IDA’s dref engine is specifically designed to pair up ADRP+ADD, and that dataflow analysis still works through the two-step addressing. OLLVM blocked xref but couldn’t block dref — it couldn’t stop its own dataflow analysis.
Round two: instead of scanning “who references the ciphertext address,” I scanned “which functions write most to the ciphertext region,” distinguishing STR (write) from LDR (read), and counting EOR instructions on the side (a strong signal of XOR decryption):
# cff_step16_find_dec_v3.py: dref-scan all functions, find the master decryptor
import idc, idautils, ida_funcs, ida_ua

CIPHER_MIN, CIPHER_MAX = 0x40000, 0x42500
candidates = []

for fn_ea in idautils.Functions():
    fn = ida_funcs.get_func(fn_ea)
    if not fn: continue
    sz = fn.end_ea - fn.start_ea
    if sz < 30 or sz > 5000:
        continue   # exclude thunks + giant init functions like sub_4000

    W_addrs, R_addrs = set(), set()
    n_eor = 0

    ea = fn.start_ea
    while ea < fn.end_ea:
        mn = idc.print_insn_mnem(ea)

        # key: dref, not xref
        for dref in idautils.DataRefsFrom(ea):
            if CIPHER_MIN <= dref < CIPHER_MAX:
                if mn in ("STR", "STRB", "STUR", "STURB"):
                    W_addrs.add(dref)
                elif mn in ("LDR", "LDRB", "LDUR", "LDURB"):
                    R_addrs.add(dref)

        if mn == "EOR":
            n_eor += 1
        ea = idc.next_head(ea)

    if len(W_addrs) > 10:
        candidates.append({
            "ea": fn_ea, "size": sz,
            "n_W": len(W_addrs), "n_R": len(R_addrs), "n_eor": n_eor,
            "W_range": (min(W_addrs), max(W_addrs)),
        })

candidates.sort(key=lambda x: -x["n_W"])
# result: 15 candidates, top 3 by write volume
The thresholds are all empirical: size < 30 excludes thunks (usually 4 instructions), size > 5000 excludes sub_4000-style giant init functions (they hoist every mini-table address onto the stack and would false-positive), n_W > 10 filters out ordinary functions that merely reference a constant or two. What’s left is almost entirely master decryptors.
The run landed data/decryptor_candidates.csv, 15 rows. The head (sorted by n_W):
addr     name        size  n_R  n_W  n_eor  W_range
0x4f34   sub_4F34    2260  107  108  18     0x40005-0x4026B
0x6df4   sub_6DF4    2532  109  108  22     0x40005-0x4026B   <- W_range identical to previous row!
0x1e418  sub_1E418   2556  119  116  23     0x41130-0x4127C
0x22ab8  sub_22AB8   1724   76   73  12     0x4152F-0x415DF
0x26b3c  sub_26B3C   1160   49   47   6     0x416E9-0x4176E
0x1d0b8  sub_1D0B8    420   13   12   5     0x41032-0x4103D
0x1d3e0  sub_1D3E0    292   11   12   5     0x41032-0x4103D   <- same W_range as previous row
... rest are smaller nodes
A few details jump out even from the table: rows two and three (sub_6DF4 / sub_1D3E0) have W_range identical to the row above — those are twins, writing the same 108 / 12 byte addresses with different MBA templates. Higher n_eor looks more like the “explicit EOR” version of OLLVM string decryption (the one that didn’t try as hard with MBA); lower n_eor likely means heavier MBA, with EOR fully replaced by bit masks. When picking a decryptor to decompile first, I prioritize n_eor > 10 versions (weaker MBA, more readable), then after simplification cross-check against the MBA-heavy twin.
Of the 15 candidates, the top three by write volume:
sub_168C4   writes 161 distinct bytes, W_range = 0x40590-0x41001    # master
sub_FB2C    writes 160 distinct bytes, W_range = 0x40642-0x40FC4
sub_10A30   writes 160 distinct bytes, W_range = 0x40642-0x40FC4    <- identical range to sub_FB2C
Note that odd fact on row three: sub_FB2C and sub_10A30 write the exact same range. First glance I thought I’d miscounted; re-ran to verify — they’re genuinely two different functions (addresses differ by 0xF04) with identical W_addrs sets. This is OLLVM’s “copy-paste MBA rewrite” pattern: every true master has an MBA-rewritten twin at an address 0x1000–0x4000 away. Algebraically equivalent, but with a different MBA template.
A concrete example — two versions of the same line, decompiled:
// sub_FB2C
byte_40F60 = (~byte_40F30 & 0x89 | byte_40F30 & 0x76) ^ 0x13;

// sub_10A30
byte_40F60 = byte_40F30 ^ 0x9A;
Algebraically the two are equivalent, because 0x89 | 0x76 = 0xFF and 0x89 & 0x76 = 0, so ~b & 0x89 | b & 0x76 = b ^ 0x89, then XOR 0x13 gives b ^ (0x89 ^ 0x13) = b ^ 0x9A — identical to sub_10A30.
These twins aren’t redundant backups; they’re a dual-MBA-write test — the same K values rendered through two different MBA templates, drawing the analyst into a “which one is real?” dead end. Detection is trivial: find two functions whose write-address sets are 100% identical, skip one of them. That alone halves the workload. Every time I found a new master afterward, I’d scan 0x1000–0x4000 around it for its twin, and almost always found one. Across the whole project I found 6 twin pairs — six free de-obfuscations saved.
6. The math: 8 MBA templates, all algebraically b ^ K
Having pinned sub_168C4 as the main decryptor, I started decompiling its decryption formula.
It’s ugly. 121 bytes of decryption formula, each wrapped in a different MBA expression. The first few I saw:
plain[0] = b ^ 0xE0;                              // plain XOR
plain[1] = ~b & 0x83 | b & 0x7C;                  // bit mask 1
plain[2] = ~((b | 0x33) & (~b | 0xCC));           // bit mask 2
plain[3] = b - 2 * (b & 0xF3) - 13;               // arithmetic 1
plain[4] = (~b & 0xE9 | b & 0x16) ^ 0xF6;         // nested XOR
plain[5] = b - 2 * (b & 0x50) + 80;               // arithmetic 2
plain[6] = ~(b & 0xA4 | ~b & 0x5B);               // bit mask 3
At first glance I got a headache, assuming I’d have to simplify each one by hand or reach for an SMT solver. I had Z3, Souper, and msynth all lined up, and was already mentally planning “write an IR converter to turn IDA’s decompiled C expressions into Z3 constraints, then simplify to an equivalent XOR form” — sounds proper, but it’s day-scale work.
Then I stared at the formulas for a bit and saw a pattern: every one of these, in reality, only does one thing — XOR.
| Formula shape | Algebraic reduction | Real operation |
|---|---|---|
b ^ K |
b ^ K |
XOR K |
~b & A | b & B (A+B=0xFF, A&B=0) |
b ^ A |
XOR A |
~((b|A) & (~b|B)) (same constraint) |
b ^ B |
XOR B |
~(b & A | ~b & B) |
b ^ ~A |
XOR ~A |
b - 2*(b & A) ± C (A single-bit or full mask) |
(b ^ A) ± C |
XOR + add/sub |
(... bitmask ...) ^ K |
double XOR chain | XOR (M ^ K) |
The proof is just a truth-table expansion. Take ~b & A | b & B with A | B == 0xFF and A & B == 0 (A and B complementary):
when a bit of b = 0:  ~b bit = 1, ~b & A = A's bit, b & B = 0
                      -> output = A's bit
when a bit of b = 1:  ~b bit = 0, ~b & A = 0, b & B = B's bit
                      -> output = B's bit
Concatenating A and B equals 0xFF, and b XOR A outputs A when b=0 and ~A = B when b=1 (given A+B=0xFF). Fully equivalent.
b - 2*(b & A) ± C looks the most intimidating but expands simply too. Per-bit behavior of b - 2*(b & A): if A’s bit is 0, then b & A’s bit is 0 and the subtraction doesn’t affect this bit; if A’s bit is 1, then b & A’s bit = b’s bit, and b - 2*(b & A) on this bit subtracts twice itself — equivalent to flipping the bit plus a carry, which accumulates across bits into b XOR A plus a constant offset ±C. Standard OLLVM MBA encoding, algebraically (b ^ A) ± C.
OLLVM used eight forms to tie analysts in knots; algebra punched them all back to one operation.
I didn’t actually hand-simplify every formula. The first version (step 17) was the dumbest possible approach: transcribe IDA’s decompiled 121 C-expression lines into Python lambdas, line by line, put them in a list, and run:
# cff_step17_apply_dec_168C4.py: first version, manually transcribed decompiler output
import ida_bytes
def b(addr):
    return ida_bytes.get_byte(addr)

# transcribe each byte_DST = expr; line from sub_168C4's decompile as a (DST, lambda) tuple
RULES = [
    # segment 1: 0x40D5D-0x40D67 -> 0x40D7D-0x40D87 (+0x20, 11 bytes)
    (0x40D7D, lambda: b(0x40D5D) ^ 0xE0),
    (0x40D7E, lambda: b(0x40D5E) ^ 0xBA),
    (0x40D7F, lambda: ((~b(0x40D5F) & 0x83 | b(0x40D5F) & 0x7C) ^ 0xE4) & 0xFF),
    (0x40D80, lambda: (b(0x40D60) - 2 * (b(0x40D60) & 0xF3) - 13) & 0xFF),
    (0x40D81, lambda: b(0x40D61) ^ 0x23),
    (0x40D82, lambda: ~(b(0x40D62) & 0xA4 | ~b(0x40D62) & 0x5B) & 0xFF),
    (0x40D83, lambda: ~((b(0x40D63) | 0x33) & (~b(0x40D63) | 0xCC)) & 0xFF),
    # ... 121 rules total
]

decrypted = {dst: fn() & 0xFF for dst, fn in RULES}
plaintext = bytes(decrypted[a] for a in sorted(decrypted))
print(plaintext.split(b"\x00"))   # 9 plaintext string segments
The upside of this approach is it’s dead stable — you eyeball the decompiler output, transcribe one line, the Python lambda runs one byte, byte-by-byte verification, almost impossible to get wrong. The downside is by line 50 of 121 I was already misaligning — copying byte_40D60 with an extra digit, typing & 0xF3 as & 0xF7, those little slips are easy to miss. In the end I fixed at least 5–6 misalignments in those 121 lines.
After pulling out 9 plaintext segments, I realized the next master (sub_FB2C) had 160 more lines to transcribe, and 14 more masters behind it — over a thousand formula lines by hand, one mistake means a full debug pass. That’s when I finally abstracted it into a general parser:
# cff_step19_parse_decomp_to_schedule.py: general schedule parser
import re

ASSIGN_RE   = re.compile(r"byte_([0-9A-Fa-f]+)\s*=\s*(.+?);", re.S)
BYTE_REF_RE = re.compile(r"byte_([0-9A-Fa-f]+)")

def parse_pseudo_to_schedule(pseudo_text):
    """turn IDA decompiler's C assignment lines into a list of eval-able Python expressions"""
    schedule = []
    for m in ASSIGN_RE.finditer(pseudo_text):
        dst_addr = int(m.group(1), 16)
        c_expr   = m.group(2).strip()

        # skip lines whose RHS has no byte_ reference (stack refs / params / temporaries)
        if not BYTE_REF_RE.search(c_expr):
            continue

        # byte_XXXX -> b(0xXXXX); wrap in & 0xFF to avoid Python's signed ~ extension
        py_expr = BYTE_REF_RE.sub(lambda mm: f"b(0x{mm.group(1)})", c_expr)
        py_expr = f"({py_expr}) & 0xFF"

        schedule.append((dst_addr, py_expr))
    return schedule

def apply_schedule(schedule, byte_func):
    """run the schedule, return dst -> plaintext byte dict"""
    return {dst: eval(expr, {"b": byte_func}) for dst, expr in schedule}

# usage:
# pseudo = open("sub_168C4_decompile.c").read()
# sched  = parse_pseudo_to_schedule(pseudo)
# result = apply_schedule(sched, byte_func=ida_bytes.get_byte)
The whole pipeline needs no SMT solver, no IR conversion, no algebraic simplification — the Python standard library is enough. There’s a mindset here worth internalizing when writing tooling: when your opponent has already expressed the information in plaintext in C code, don’t bother doing the “understanding” step — just treat the code as a function and run it. Hex-Rays decompilation is already high-quality C; IDA already did a semantic-extraction pass for you. You only need to execute it.
After step 19, the remaining 14 masters all went straight through decompiled pseudocode and produced their full plaintext in under 30 seconds. This is the most reusable artifact of the entire project — next time I meet any OLLVM string decryptor, feed the pseudocode in and get near-instant results. The later steps (20–23, batch-running FB2C / 3 big masters / 3 medium masters / 8 minor masters) all build on this parser, averaging under 30 lines per master.
Landed in data/:
data/dec_168C4_schedule.csv      12  KB   sub_168C4's 121-line decryption schedule
                                          (dst_addr, src_addr, py_expr, key, ...)
data/dec_168C4_schedule.json     33  KB   JSON version of the above
data/decrypted_strings.csv       1.4 KB   first batch of 9 plaintext segments
data/decrypted_strings.json      4.5 KB   JSON version
data/dec_summary.json            2.2 KB   decryption summary (master funcs / segments / bytes)
dec_168C4_schedule.csv lists each byte’s decryption formula plus the real key after equivalent-XOR reduction. I kept this file specifically to preserve a sample of “what OLLVM byte-level obfuscation actually looks like” — next time I write a decryptor for some other obfuscator, I can use this as a template and skip re-deriving the eight MBA-template reductions from scratch.
After running sub_168C4’s 121 lines, I extracted the 9 ciphertext→plaintext segment mappings:
seg 1   0x40D5D-0x40D67  ->  0x40D7D-0x40D87  +0x20  11 bytes
seg 2   0x40DD0-0x40DDE  ->  0x40DDF-0x40DED  +0x0F  15 bytes
seg 3   0x40E40-0x40E54  ->  0x40E60-0x40E74  +0x20  21 bytes
seg 4   0x40BF1-0x40BFD  ->  0x40BFE-0x40C0A  +0x0D  13 bytes
seg 5   0x40570-0x40585  ->  0x40590-0x405A5  +0x20  22 bytes
seg 6   0x40B00-0x40B13  ->  0x40B20-0x40B33  +0x20  20 bytes
seg 7   0x40C90-0x40CA8  ->  0x40CB0-0x40CC8  +0x20  25 bytes
seg 8   0x40AD2-0x40AE1  ->  0x40AE2-0x40AF1  +0x10  16 bytes
seg 9   0x40FD0-0x40FE1  ->  0x40FF0-0x41001  +0x20  18 bytes
Note the pattern “ciphertext region first, plaintext region after, offset +0x20 appearing six times” — this OLLVM decryptor places its plaintext output buffer at a fixed offset. That’s its engineering convenience and our attack surface. Once you spot it, finding the other masters’ plaintext regions becomes templated: given a ciphertext start, look for the plaintext region at the common offsets +0x10, +0x0D, +0x0F, +0x20 — it almost always hits. Once that offset pattern is recognized, the remaining masters are pure pipeline work: find write location → decompile formula → eval the key → reassemble plaintext.
7. First plaintext: 9 strings blow the whole mechanism open
The 9 plaintext segments were:
0x40D87:  rRequest:                   ; add-friend request SEL suffix
0x40DDF:  ObfuscatedTokenService      ; ★ ObjC class name
0x40E60:  ObfuscatedClientCacheManager; ★ ObjC class name
0x40BFE:  checkConfig                 ; ★ SEL
0x40590:  reportCrashLog:type:        ; ★★★ a nullified hook!
0x40B20:  reportDeviceToken:          ; ★★ device-token reporting
0x40CB0:  refreshTokenWithPolicy:     ; ★★ token refresh
0x40AE2:  getAppSignType              ; app signature type
0x40FF0:  isJailbrokenDevice          ; ★★★★ jailbreak detection!
The moment the first segment came out, I understood what this dylib was doing.
isJailbrokenDevice, combined with the 9 nullsub_1 newImps I found later, made the mechanism completely clear: the dylib hooks every method the target app uses to detect jailbreak and report security events, replacing each with a no-op or a forged return value.
reportCrashLog:type: is swapped for nullsub_1 (at the assembly level, just MOV X0, #0; RET). Any caller gets an immediate return — crash info never reaches the server. Crash logs are extremely high-value in fraud control: a hook tool’s crash patterns differ wildly from a normal user’s (frequent crashes inside the ObjC runtime, stack frames carrying MobileSubstrate traces, crash addresses pinned to specific hook trampolines). Cutting that reporting path cuts a core signal source.
isJailbrokenDevice is hooked to always return NO. Every if ([self isJailbrokenDevice]) { ban_user(); } in the app takes the “not jailbroken” branch. Classic single-point replacement — crude but effective, since any client-side “boolean verdict” can be defeated by hooking the return value.
ObfuscatedTokenService is the target app’s token-system core class. The dylib intercepts its refreshTokenWithPolicy: and friends, controlling token-refresh behavior to keep the account looking “legit.” The token is the account’s server-side “pass” — it refreshes on a policy, and if the server notices a refresh pattern that’s off (refreshing when it shouldn’t, parameters mismatching history), it triggers a fraud re-check. Hooking this layer means controlling the refresh cadence so it matches normal-user statistics.
That’s when I realized something important: this dylib isn’t cracking the target app’s fraud algorithm — it’s cutting the fraud system’s information sources. That’s classic high-dimensional defeat-by-downgrade. The algorithm can be as strong as you like — if the data never arrives, it’s zero. The server could be running state-of-the-art graph neural nets for account-relationship modeling and LSTM for behavioral time-series anomaly detection, but if the client never reports “isJailbrokenDevice = YES” and never sends crash logs, the model is just guessing.
But 9 segments didn’t satisfy me. __data holds 0x40328 bytes of ciphertext — those 161 bytes were only 4%. Where was the other 96%? At the time I assumed sub_168C4 had covered the whole hook-string region (0x40500–0x41100) and the rest was something else — error messages, debug strings, internal protocol fields. That assumption turned out to be completely wrong: the real hook strings span the entire 0x40000–0x42500 range, and I’d only dug a small patch at the entrance. That misjudgment cost me another half day — I went off to decompile the 38 newImp functions first, then circled back to hunt more masters. If I’d widened the search to the whole __data from the start, I’d have saved a day.
8. Widening the search: twins + double mirror
Here I made another mistake: I assumed I’d found everything.
I’d scanned the cipher region 0x40500–0x41100 because that was sub_168C4’s write range. I thought that was the whole ciphertext. It wasn’t until I looked at sub_FB2C (flagged as a twin) and its twin sub_10A30’s W_range — 0x40642–0x40FC4, partially overlapping but not identical to sub_168C4 — that I realized two masters aren’t a “primary/backup” pair covering the same region; they manage different string regions. That fact demolished my “161 bytes = total hook strings” assumption.
I widened the search to the entire __data segment (0x40000–0x42500) and re-ran the same dref scan, this time finding 17 master decryptors (including 5 twin pairs). That left me with another lesson: once you’ve set a “string region” boundary in reverse engineering, always re-scan at 3–5× that range. The boundary is usually the analyst’s assumption, not the data’s reality. My earlier 281-byte boundary, expanded 3–5×, lands exactly on the true ~1100-byte span — and that magnitude relationship isn’t coincidence. First-pass boundaries are always underestimated because you only see the obvious structure at the entrance and miss the scattered, less-conspicuous string regions behind it.
Running them all accumulated 66 distinct plaintext strings, 981 bytes — jumping from 4% coverage to near-total.
Master            Plaintext range        Bytes  Main content
sub_168C4         0x40590-0x41001        161    hook main region (ObfuscatedTokenService series)
sub_FB2C          0x40642-0x40FC4        160    hook main region (ObfuscatedContext / ExptService)
sub_5A4C          0x400D5-0x4031F        215    anti-cheat core classes (ObfuscatedRuntimeIntegrity etc.)
sub_4F34          0x40005-0x4026B        108    dylib header (isEnvironmentTrusted etc.)
sub_1E418         0x41130-0x4127C        116    A/B config keys
sub_22AB8         0x4152F-0x415DF         73    state-dictionary keys
sub_26B3C         0x416E9-0x4176E         47    jailbreak-trace erasure
sub_33CE8+sub_33A24 0x41BA0-0x41BBC       29    ★ first 29 bytes of SHA-256("") forgery
sub_2E5E8         0x4196A-0x41A64         12 statically visible / 96 invisible
                                               stack-pointer variant
... 8 more minor nodes: auxiliary class names
That last sub_2E5E8 is this project’s dead corner — section 11. Landed in data/:
data/master_decryptors.csv       348  B   17 master function list (incl. 5 twin pairs)
data/all_decrypted_strings.csv   4.4 KB   66 distinct plaintexts (the study's most important output)
data/all_decrypted_strings.json  10  KB   JSON version
all_decrypted_strings.csv has one plaintext string per row, plus its address, length, which master decrypted it, and the raw hex prefix. The first 10 rows:
addr      length  plaintext                       master       raw_hex (prefix)
0x40005   4       B@:@                            sub_4F34     42403a4000
0x40030   17      auditLoadedImages               sub_4F34     6175646974...
0x40070   20      verifyCodeSignature:            sub_4F34     76657269...
0x400D5   15      startMonitoring                 sub_5A4C     7374617274...
0x400B0   20      isEnvironmentTrusted            sub_4F34     6973456e76...
0x401A0   25      ObfuscatedSecurityPolicyValidator sub_5A4C   4d4d5365...
0x40240   17      ObfuscatedAntiTamperGuard       sub_5A4C     4d4d416e74...
0x402B0   24      validateCertChain:depth:        sub_5A4C     76616c6964...
0x402CE   3       set                             sub_5A4C     73657400
0x40300   31      com.[redacted].xin.security.policy  sub_5A4C  636f6d2e...
... (66 rows total)
The short 4–5 byte strings like B@:@, v@:, @@: are ObjC method type encodings (B = BOOL, @ = id, : = SEL, v = void, i = int) — the method-signature format ObjC runtime uses in APIs like class_addMethod. Their presence in the decrypted output means the dylib doesn’t only swizzle existing methods — it also adds methods via class_addMethod, matching the _class_addMethod imports I’d seen in hook-registration functions like sub_1BB50. Standard ObjC dynamic-method-addition flow.
com.[redacted].xin.security.policy is the target app’s security-policy NSUserDefaults suite name (possibly an entitlement key or CFBundle sub-identifier). Once an internal namespace like that is exposed, it hands an opponent the index to “where the target app keeps its security configs.” The instant I saw this string I knew the dylib author likely had inside knowledge — that namespace is near-impossible to guess by pure RE; either they had internal docs or they reversed multiple app versions and cross-referenced.
In the middle of all this came an unexpected find — the hook registry is double-mirrored. I plotted the 167 hook sites by address range:
0x118dc - 0x11dc0   ~64 hooks
0x1bb98 - 0x1c2b4   ~64 hooks   <- identical SEL/Class sequence to the line above!
0x12128 - 0x121b8   ~6 hooks, signature-related
0x16598 - 0x16624   ~6 hooks, signature-related
0x1c134 - 0x1c2b4   ~20 hooks, Token/Crash-related
Those two 64-hook segments are the same list. I first suspected my script miscounted, then compared each hook’s SEL address + Class address pairs — genuinely the same sequence twice, just with different registration-function names (sub_1BB50 and sub_118D4) and near-identical code bodies (1500 bytes vs 1412 bytes, the difference mostly from OLLVM’s MBA rewrite during copying). Guesses at the reason:
ObjC swizzling runs once at each of the two +load timings (early and late)
Anti-unload: even if a script unhooks one copy, the other still lives
Version compatibility: one for app 8.0.30, one for 8.0.40, selected at runtime
I lean toward the third.
9. The full 167-hook map: from raw binary back to the battle diagram
At this point I had all the pieces: 66 plaintext strings and 167 hook-registration sites. What remained was correlating each hook’s SEL/Class with the plaintext — assembling the scattered parts into a whole machine. The strings tell you what the dylib wants to hook; the sites tell you where it hooks; together they form the complete attack map.
Each hook-registration site looks like this:
; roughly within the 40 instructions before each hook, these two ADRP+ADD pairs build string addresses
ADRP X0, #class_name_addr@PAGE
ADD  X0, X0, #class_name_addr@PAGEOFF   ; X0 = ObjC class-name address
...
ADRP X1, #sel_name_addr@PAGE
ADD  X1, X1, #sel_name_addr@PAGEOFF      ; X1 = SEL string address
...
BL _MSHookMessageEx ; (in practice LDR + BR indirect call)_MSHookMessageEx’s standard signature is void MSHookMessageEx(Class cls, SEL sel, IMP newImp, IMP *origImp) — first arg the target class, second the selector, third the replacement implementation, fourth an out-param pointer for the original IMP. So in the ADRP+ADD sequence before a hook site, the first two pairs build string addresses (class name and SEL name) passed to _objc_getClass and _sel_registerName, which turn strings into runtime objects and feed MSHookMessageEx. Standard Substrate-tweak dynamic-registration flow, structurally stable.
Two steps: step 6 extracts the 167 hook sites’ raw info (which ObjC class, SEL, newImp, origImp slot address each site is), step 25 correlates those addresses against the step-17/19 plaintext table.
Step 6’s core: for each hook-registration function (sub_1BB50 / sub_118D4 / sub_1C12C / sub_12114 / sub_16504), linearly scan for all BL _MSHookMessageEx calls, then for each call scan backward 25 instructions looking for ADRL targets. SEL identification isn’t just “ADRL before BL _MSHookMessageEx” — it’s first finding BL _sel_registerName, then looking at the ADRL X0 immediately before it. That’s the stable ObjC dynamic-registration pattern:
# cff_step6_extract_hooks.py: extract 167 hook triples from 5 registration functions
def extract_hooks_from_func(fn_ea):
    insns = list(decode_function(fn_ea))   # [(ea, mnem, ops, op_vals), ...]
    hooks = []

    # 1) find all BL _MSHookMessageEx or its thunks (0x38xxx range)
    hook_calls = []
    for i, (ea, mn, ops, ovs) in enumerate(insns):
        if mn != "BL":
            continue
        target = ovs[0]
        target_name = idc.get_name(target) or ""
        if "_MSHookMessageEx" in target_name or 0x38000 <= target < 0x39000:
            hook_calls.append((i, ea))

    # 2) scan backward 25 instructions for each hook call
    for call_idx, call_ea in hook_calls:
        sel_str = class_str = newImp = origImp = None

        for j in range(call_idx - 1, max(call_idx - 25, -1), -1):
            ea_j, mn_j, ops_j, ovs_j = insns[j]

            if mn_j == "ADRL":
                dst = ops_j[0].strip()
                tgt = ovs_j[1]
                # ADRL X2/X3 are usually newImp / origImp slots
                if dst == "X2" and newImp is None:
                    newImp = tgt
                elif dst == "X3" and origImp is None:
                    origImp = tgt

            elif mn_j == "BL":
                tname = idc.get_name(ovs_j[0]) or ""
                # ADRL X0 before _sel_registerName is the SEL string address
                if "_sel_registerName" in tname and sel_str is None:
                    if j > 0 and insns[j-1][1] == "ADRL":
                        sel_str = read_cstring(insns[j-1][3].Op2.value)
                # ADRL X0 before _objc_getClass is the Class string address
                elif "_objc_getClass" in tname and class_str is None:
                    if j > 0 and insns[j-1][1] == "ADRL":
                        class_str = read_cstring(insns[j-1][3].Op2.value)

        hooks.append({
            "site": call_ea, "class": class_str, "sel": sel_str,
            "newImp": newImp, "origImp_slot": origImp,
        })
    return hooks

all_hooks = []
for fn_ea in [0x1BB50, 0x118D4, 0x1C12C, 0x12114, 0x16504]:
    all_hooks.extend(extract_hooks_from_func(fn_ea))
# result: 167 hook triples
The 25-instruction backward window is an empirical value. I started with 15 and missed ADRL pairs stretched apart by OLLVM; then tried 50 and swept in the previous hook’s string references too. 25 is the compromise that covers a whole hook-registration block without polluting the previous hook.
After step 6, the class_str / sel_str may still be ciphertext — if the string region wasn’t decrypted yet, read_cstring returns high-entropy binary. So the real plaintext hook list has to wait until step 17/19 decrypts the strings, then step 25 does the correlation:
# cff_step25_join_hooks_strings.py: correlate hook sites with the plaintext table
import json, idc, idautils

# already-decrypted string table: [{"addr": 0x40DDF, "plaintext": "ObfuscatedTokenService", "length": 14}, ...]
plaintext_table = json.load(open("data/all_decrypted_strings.json"))

def lookup_str(addr):
    """if addr falls inside a plaintext string, return it; supports mid-string hits (pointer into middle)"""
    for s in plaintext_table:
        if s["addr"] <= addr < s["addr"] + s["length"] + 1:
            return s, addr - s["addr"]
    return None, 0

def find_str_refs(site_ea, lookback=40):
    """scan back 40 instructions from the hook site, collect all ADRP+ADD addresses landing in the cipher region"""
    refs = []
    ea = site_ea
    for _ in range(lookback):
        ea = idc.prev_head(ea)

        # 1) IDA dref (addresses assembled by ADRP+ADD dataflow analysis)
        for dref in idautils.DataRefsFrom(ea):
            if 0x40000 <= dref < 0x42500:
                refs.append(dref)

        # 2) manual ADRP+ADD pairing (IDA sometimes misses these; fallback)
        if idc.print_insn_mnem(ea) == "ADRP":
            base = idc.get_operand_value(ea, 1)
            nx   = idc.next_head(ea)
            if idc.print_insn_mnem(nx) == "ADD":
                offs   = idc.get_operand_value(nx, 2)
                target = base + offs
                if 0x40000 <= target < 0x42500:
                    refs.append(target)
    return refs

# main
results = []
for h in all_hooks:
    refs = find_str_refs(int(h["site"], 16))
    str_refs = []
    for addr in set(refs):
        s, off = lookup_str(addr)
        if s:
            str_refs.append({"plaintext": s["plaintext"], "offset": off})
        else:
            # not yet decrypted: read cipher hex for later audit
            cipher = bytes(idc.get_wide_byte(addr+k) for k in range(64))
            cipher = cipher[:cipher.index(0)] if 0 in cipher else cipher
            str_refs.append({"cipher_hex": cipher.hex()})
    results.append({"site": h["site"], "refs": str_refs})

# result: 164/167 got >= 2 string refs (complete SEL+Class pair)
Two details here. First, find_str_refs uses both idautils.DataRefsFrom (IDA dref) and a manual ADRP+ADD pairing as fallback — dref alone misses some instruction pairs that OLLVM stretched apart, and the manual pairing covers the remaining ~5%. Second, lookup_str supports “mid-string hits” — an ADRP+ADD pair doesn’t necessarily assemble the start of a string; it might be the address of a character in the middle (say, the t in "reportCrashLog:type:"), and you need to back out to the full string from the offset. Without mid-string support, this step would have missed about 20% of hooks. I found that on my first run: 30-some hooks’ SEL/Class were “missing,” and I debugged for ages before realizing ADRP+ADD had assembled a mid-string address.
Result: 164/167 got full SEL+Class pairs; 3 only got one reference — those 3 are likely class_addMethod rather than MSHookMessageEx (the former only needs a Class, no existing SEL). 98% coverage is more than enough; the business understanding won’t have blind spots from 3 missing hooks.
The unsolved part is mainly sub_2E5E8, that stack-pointer-variant decryptor I never fully cracked — 96 bytes of ciphertext whose address source I couldn’t find. Those 96 bytes are likely “secondary” auxiliary class names (since sub_2E5E8 writes to the dylib header, usually holding base class metadata), and they don’t affect the core hook table’s readability.
The final correlation, organized by business category:
Anti-cheat core classes (target-app side)
ObfuscatedRuntimeIntegrity         — runtime integrity
ObfuscatedSecurityPolicyValidator  — security policy validator
ObfuscatedAntiTamperGuard          — anti-tamper protection
ObfuscatedTokenService             — token service (fraud-control core)
ObfuscatedClientCacheManager       — client cache manager
ObfuscatedContext                  — target app global context
ExptService                        — A/B experiment service
CUtility                           — utility class
These eight classes are basically the skeleton of the target app’s iOS anti-cheat architecture. ObfuscatedRuntimeIntegrity answers “what environment am I running in?” (jailbreak, debugger, injection); ObfuscatedSecurityPolicyValidator answers “have I been modified?” (signature, certs); ObfuscatedAntiTamperGuard continuously monitors runtime state; ObfuscatedTokenService talks to the server (identity tokens, security-event reporting); ObfuscatedContext is the global context; ExptService is the A/B config layer; ObfuscatedClientCacheManager manages caches (which hold the runtime state dictionary); CUtility is a utility collection. An anti-detection dylib whose hook list hits these eight classes has pierced all six layers of the target’s anti-cheat stack — none survived.
Hooked key SELs
isJailbrokenDevice                      -> NO
isEnvironmentTrusted                    -> YES
auditLoadedImages                       -> skip (filter out MobileSubstrate paths)
verifyCodeSignature:                    -> YES
validateCertChain:depth:                -> trusted
getAppBundleSignatureHash               -> original expected value
getAppSignType                          -> original type
flushSecurityEvents                     -> return (nullify)
reportCrashLog:type:                    -> return 0 (nullsub_1)
reportDeviceToken:                      -> return (nullify)
refreshTokenWithPolicy:                 -> return (nullify)
getStringExpt:                          -> hijack
getBoolExpt:                            -> hijack
startVerifyContact:opcode:verifyMsg:    -> add-friend core action (modify params)
sendVerifyUserRequest:                  -> add-friend request
checkConfig                             -> config hijack
startMonitoring                         -> no-op
refreshPolicyStore                      -> no-op
auditLoadedImages — the name gives it away: “scan every image dyld has loaded, look for MobileSubstrate / Cydia / Theos jailbreak traces.” The dylib hooks it to “filter itself out” — on call it returns the image list but strips its own and Substrate’s entries. That’s an interesting detail: the author didn’t just make auditLoadedImages return empty — empty would instantly trip fraud control (“no dylibs loaded? this device is abnormal”). Instead they return a filtered real list that statistically matches a normal user exactly.
startVerifyContact:opcode:verifyMsg: is where the sample’s name comes from — it’s the target app’s add-friend request core method. Once hooked, the author might stuff special wording into verifyMsg to lower the chance the other party reports, tweak opcode to dodge “bulk add-friend” patterns, or throttle call frequency. The exact behavior depends on the newImp implementation, which statically I can’t fully see.
A/B config keys (hijack targets)
clicfg_[redacted]_ios_runtime_sdk_dc_dc_report_enable           -> NO
clicfg_[redacted]_ios_runtime_sdk_main_cert_chain_report        -> NO
cert_valid                                                       -> write YES
env_abnormal                                                     -> write NO
jb_indicator                                                     -> removeObjectForKey:
The clicfg_[redacted]_ios_runtime_sdk_* keys follow the target app’s ConfigManager naming convention — clicfg = “client config,” the redacted middle token looks like an internal team code, ios_runtime_sdk marks it as the iOS client’s runtime security SDK. Hook these two to return NO and the entire reporting chain is shut off at the source — more elegant than nullify-interception. cert_valid / env_abnormal / jb_indicator are state-dictionary keys; the dylib directly edits the dictionary to erase the client’s “self-recorded state,” so the app’s next self-check sees “everything normal.”
Landed in data/:
data/hooks_extracted.json        39  KB    167 hook-registration sites, raw
                                           (class/sel may still be ciphertext addresses)
data/all_hooks_decrypted.csv     63  KB    167-hook full correlation table
                                           (site, newImp, Class, SEL, all_refs)
data/all_hooks_decrypted.json    283 KB    JSON version, with detailed ref chains
data/nullify_hooks.csv           1.1 KB    9 nullify-hook triples
data/newimp_classification.csv   1.8 KB    38 newImp classifications
nullify_hooks.csv is pulled out separately because those 9 hooks are the anti-detection “attack core.” The table:
reg_func    site       newImp     newImp_kind   sel_addr   class_addr
0x1bb50     0x1be44    0x29e34    nullsub_1     0x4092E    0x40944
0x1bb50     0x1be50    0x29e34    nullsub_1     0x4092E    0x40944
0x1bb50     0x1be60    0x29e34    nullsub_1     0x4092E    0x40910
0x118d4     0x11b88    0x29e34    nullsub_1     0x40A30    0x4092E (via wrapper)
0x118d4     0x11b94    0x29e34    nullsub_1     0x40A30    0x4092E (via wrapper)
0x118d4     0x11ba4    0x29e34    nullsub_1     0x40A30    0x40910 (via wrapper)
0x1c12c     0x1c248    0x32250    return_0      0x40590    0x40970 (via wrapper)
0x1c12c     0x1c254    0x32250    return_0      0x40590    0x40970 (via wrapper)
0x1c12c     0x1c264    0x32250    return_0      0x40590    0x40DDF
0x40590 we already decrypted as reportCrashLog:type:, replaced with 0x32250 (return_0) (assembly: MOV X0, #0; RET) — any caller returns 0 immediately. nullsub_1 at 0x29e34 is an empty function, just a RET. These 9 hooks are the anti-detection “attack bullseye”; the other 158 hooks are all a “camouflage layer” (transparent forward + state-dictionary erasure + A/B config hijack) to keep those 9 nullifies from being noticed.
newimp_classification.csv classifies all 38 distinct newImps used by the hooks:
addr       name       kind       last_insn   note
0x29e34    nullsub_1  REAL_FUNC  RET        ★ real function: no-op
0x32250    sub_32250  REAL_FUNC  RET        ★ real function: return 0
0x1c2f0    sub_1C2F0  BDD_NODE   BR X2      ends in BR, still inside the BDD
0x1df6c    sub_1DF6C  BDD_NODE   BR X11     ends in BR
0x20750    sub_20750  BDD_NODE   BR X9
0x21e70    sub_21E70  BDD_NODE   BR X15
0x22138    sub_22138  BDD_NODE   BR X8
... the other 31 newImps are all BDD_NODE (end in BR Xn)
Of the 38 newImps, only 2 are real RET-terminated functions; the other 36 all end in BR Xn — still dispatching inside the BDD. That means most hooks’ “replacement implementations” aren’t hardcoded logic but another BDD subtree that re-dispatches on state. The concrete parameter-rewriting and return-value-forging logic hides deeper in the BDD, and statically you can’t see it all — full visibility needs dynamic debugging. That’s the “last mile” shortfall of static analysis on this dylib: the hook list is complete, but the replacement behavior still needs runtime observation.
10. The SHA-256(“”) forgery
Two of the minor decryptors turned out to be worth their weight. sub_33CE8 decrypts 7 bytes e3b0c44 at 0x41BA0, and sub_33A24 decrypts 22 bytes 298fc1c149afbf4c8996fb at 0x41BA7. Concatenated, they form a 29-byte prefix that I immediately recognized as the front of SHA-256 of the empty string:
e3b0c44298fc1c149afbf4c8996fb92427ae41e4649b934ca495991b7852b855The full constant is the well-known SHA-256(""). What’s it doing here? The dylib hooks the target app’s integrityHash getter to return this forged value directly. The server only validates that the hash is hex-formatted — it doesn’t verify the value is actually bound to the app’s data. So returning SHA-256("") satisfies the format check while providing zero real integrity.
This is the kind of detail that separates “someone who just ran an off-the-shelf hook” from “someone who studied the server’s validation logic.” They knew the server checks format but not binding, and they exploited exactly that gap.
11. sub_2E5E8 — the stack-pointer variant
sub_2E5E8 is the dead corner I mentioned. Its signature:
__int64 __fastcall sub_2E5E8(int a1, _BYTE *a2, _BYTE *a3, _BYTE *a4, _BYTE *a5)But it uses a private calling convention that also consumes X11–X16. It has five pointer-segment pairs:
X11 -> X12   18 bytes
X13 -> X14   19 bytes
X15 -> X16   16 bytes
X1  -> X2    26 bytes
X3  -> X4    17 bytes
             ---- total 96 bytes
plus 2 ADRL-visible segments (12 bytes, which decrypt to NSNumber\0). That 96-byte block is a static dead corner — the caller reaches it via an indirect BR, so IDA’s xref never sees it. The 96 bytes are likely more auxiliary class metadata, but I couldn’t recover their address source, so they stay unsolved. It’s the one loose thread I didn’t get to pull.
12. The six-layer defense — and how all six fall
Assembling everything, the target app’s anti-detection stack has six layers, and this dylib has a counter for every one:
| # | Defense layer | Class / mechanism | Hook counter |
|---|---|---|---|
| ① | Environment-trust detection | ObfuscatedRuntimeIntegrity |
isJailbrokenDevice→NO, isEnvironmentTrusted→YES, auditLoadedImages→skip |
| ② | Signature / integrity check | ObfuscatedSecurityPolicyValidator |
verifyCodeSignature:→YES; CUtility validateCertChain:→trusted, getAppBundleSignatureHash→original value, integrityHash→SHA-256(“”) forgery |
| ③ | Anti-tamper monitoring | ObfuscatedAntiTamperGuard |
startMonitoring→no-op, refreshPolicyStore→no-op |
| ④ | Event-reporting channel | ObfuscatedTokenService |
flushSecurityEvents→return, reportCrashLog:type:→nullsub_1, reportDeviceToken:→return, refreshTokenWithPolicy:→return |
| ⑤ | A/B config switch | ExptService |
getBoolExpt:(@"clicfg_[redacted]_ios_runtime_sdk_dc_dc_report")→NO |
| ⑥ | State dictionary + core action | NSDictionary, ObfuscatedContext |
removeObjectForKey:(@"jb_indicator"), startVerifyContact:opcode:→modify params |
Layer ⑥ is the punchline: NSDictionary removeObjectForKey:(@"jb_indicator") literally deletes the jailbreak indicator the client recorded about itself, and ObfuscatedContext startVerifyContact:opcode: rewrites the add-friend parameters. The first five layers are about not getting caught; the sixth is about actively erasing the evidence.
The architectural takeaway is the same one from section 7: none of these hooks touch the fraud algorithm. They all touch the inputs. Six layers of detection, each with its data source cut or forged. The strongest server-side model in the world can’t flag what the client never reports.
13. What I didn’t finish
This is a static analysis, and there are honest loose ends:
- The 36 BDD-wrapped newImps’ parameter-rewriting details (need dynamic debugging).
sub_2E5E8’s 96-byte block (stack-pointer variant, address source unresolved).sub_F584— a second dyld init, 1296 bytes, not fully reversed.sub_B50C—dyld_register_func_for_add_image, 1740 bytes, which builds theoff_47358table; not fully reversed.
None of these block the core conclusion — the hook map is complete and the anti-detection mechanism is fully understood — but a thorough job would chase each of them down with a debugger.
14. Deliverables
The final artifact set. Nineteen scripts in lib/ (from cff_step1_x20map.py to cff_step26_run_2E5E8_adrl.py), and in data/:
trampolines.json              223 trampolines
all_hooks_decrypted.csv       167 hooks
nullify_hooks.csv             9 nullify hooks (the attack core)
newimp_classification.csv     38 newImps
all_decrypted_strings.csv     66 plaintext strings / 981 bytes
The whole point
The obfuscator author’s bet was that 1492 functions, a shared dispatch table, stack-demoted state, and indirect everything would make a reverser quit. The bet was wrong in an instructive way: they optimized for intimidation, not for information density.
Each trampoline hid exactly one bit. The dispatch table was shared but statically readable. The string decryptor was MBA-wrapped but algebraically XOR. The hooks were hidden behind thunks but had to live in an 8-byte slot somewhere. Every “scary” surface turned out to have a structural invariant underneath it, and structural invariants are exactly what you can script against.
The de-obfuscation dropped from person-weeks to person-days the moment I stopped treating it as “1492 functions” and started treating it as “one BDD, 223 decision nodes, each carrying one bit.” The hardest part of this job was never the math or the tooling — it was un-learning the mental model the obfuscator was built to install.
Colin Xiao — I take on contract reverse-engineering work, and writeups like this are how I show what I can do. If you need help with anything in this space — including but not limited to the areas I cover above — I’m available. No project is too big or too small — if it’s reverse engineering and I can do it, I’ll take it. DM me on X (@colinxiao_lab) or Telegram (@ColinXiao666).
Get in touch