De-obfuscating VMP 3.5 Virtualization: A Trace-and-Eliminate Methodology
About the author. I’m Colin Xiao — an independent reverse engineer, mostly working solo on contract jobs. I dig into compiled code of every kind, including but not limited to: Android and iOS apps, x86/x64/ARM native binaries, packers and obfuscators, DRM and license checks, network protocols and APIs, crypto and signature algorithms, malware, game binaries, and embedded/IoT firmware. I also handle large-scale data collection and vulnerability research. If you have any project in mind, I’d be glad to take it on — whatever it is, as long as it’s within my wheelhouse. Just reach out. You can reach me on X at @colinxiao_lab or on Telegram at https://t.me/ColinXiao666.
This research is published for educational and defensive purposes. The target sample is anonymized throughout.
De-obfuscating VMP 3.5 Virtualization: A Trace-and-Eliminate Methodology
Anyone who has opened a VMProtect-virtualized binary knows the feeling: a wall of CALLs and JMPs with no visible logic, and a strong urge to close the debugger. The conventional advice — “watch an expert do it” — doesn’t survive contact with a real schedule. A few hundred lines of demo, or a speedrun video, is a poor teacher when you only have an hour or two of study a day, and the moment you lose track of which virtual register maps to which physical register, you start over.
So I took a different approach: instead of memorizing VMP’s internals first, I wrote a tool that automates the part that makes VMP painful — the obfuscation — and let the tool teach me the structure. This article walks through that tool’s de-obfuscation pipeline: dynamic trace, semantic lifting to PCode, and dead-code elimination. It is deliberately aimed at readers who are new to VM protection; the goal is the methodology, not a complete unpack.
Why de-obfuscation has to come first
VMP virtualizes a function by replacing its entry point with a dispatcher that enters a custom virtual machine. Even when you select virtualization only and disable every other protection, the virtual machine still ships with a lot of obfuscation and jump chaff. Trying to analyze the VM without removing that noise first is miserable — hard to analyze, hard to fingerprint, hard to find patterns. So I put the virtualization curiosity aside and started with de-obfuscation.
The high-level idea is simple: convert assembly into PCode semantics (which registers are read, which are written), then scan top-to-bottom for instructions whose results are never used. A trivial example:
mov rax, 0x123
mov rax, 0x456
If no instruction between the two lines reads rax, then mov rax, 0x123 is dead — pure obfuscation.
The challenge is doing that reliably at scale. Two problems surface immediately:
- Rule precision. If the matching logic is too strict, de-obfuscation is incomplete; too loose, and it deletes real code. The only way to know is to look at whether real code was misclassified as junk — a huge amount of manual work.
- Control flow. The code is full of jumps. Do you follow jumps inward, or de-obfuscate by address order? What about
jz— taken or not? Without knowing the execution order you can’t know what the next instruction will actually be, so you can’t de-obfuscate efficiently.
The solution I settled on: simulate execution first to determine the real instruction flow, record all registers and the common stack region (e.g. RSP ± 0x100), and then de-obfuscate along the correct path — re-running the simulation afterward and comparing register state to verify the de-obfuscation didn’t change semantics. (That approach has its own caveats, which I’ll come back to.)
The tool
To drive this, I built DisassembleVmp, a helper that connects to x64dbg and automates the analysis loop.
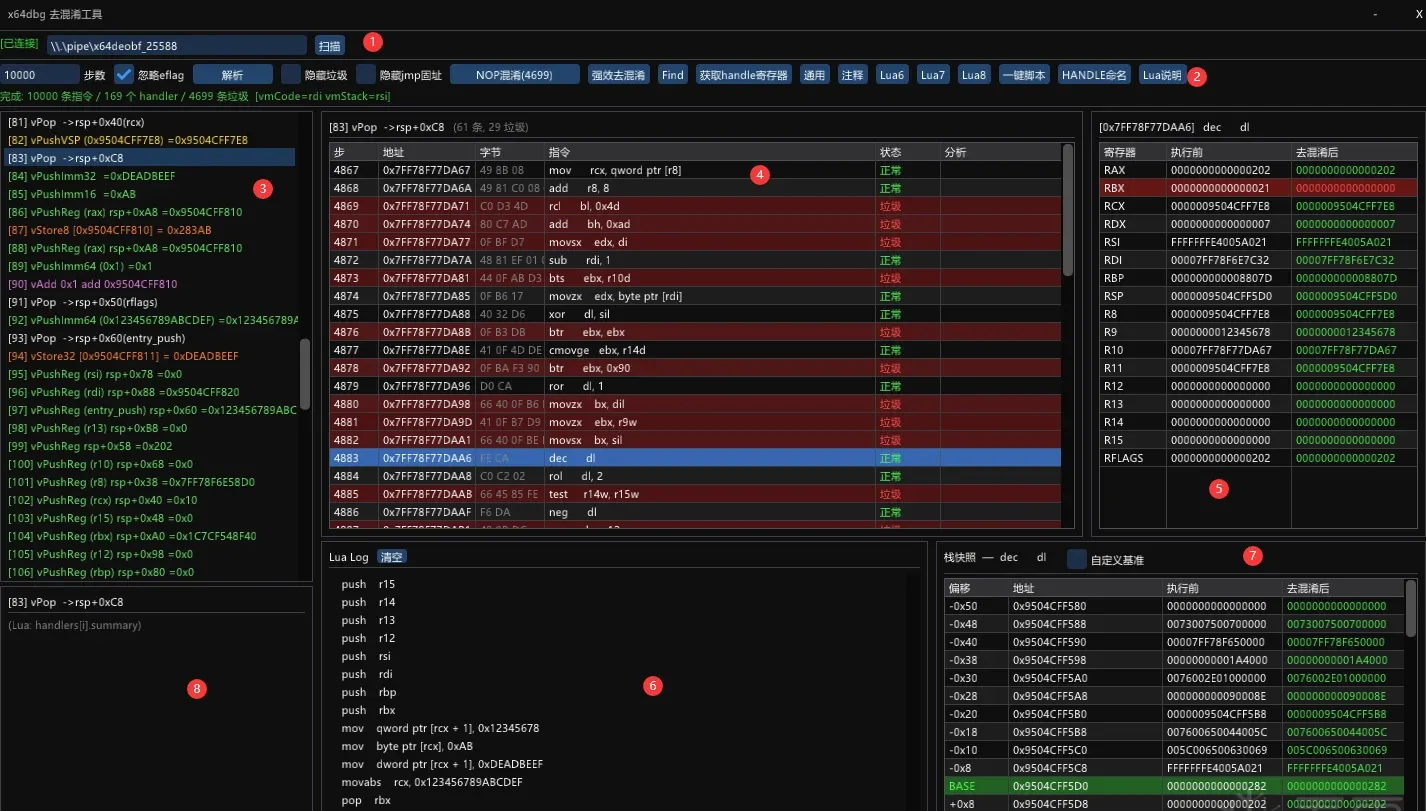
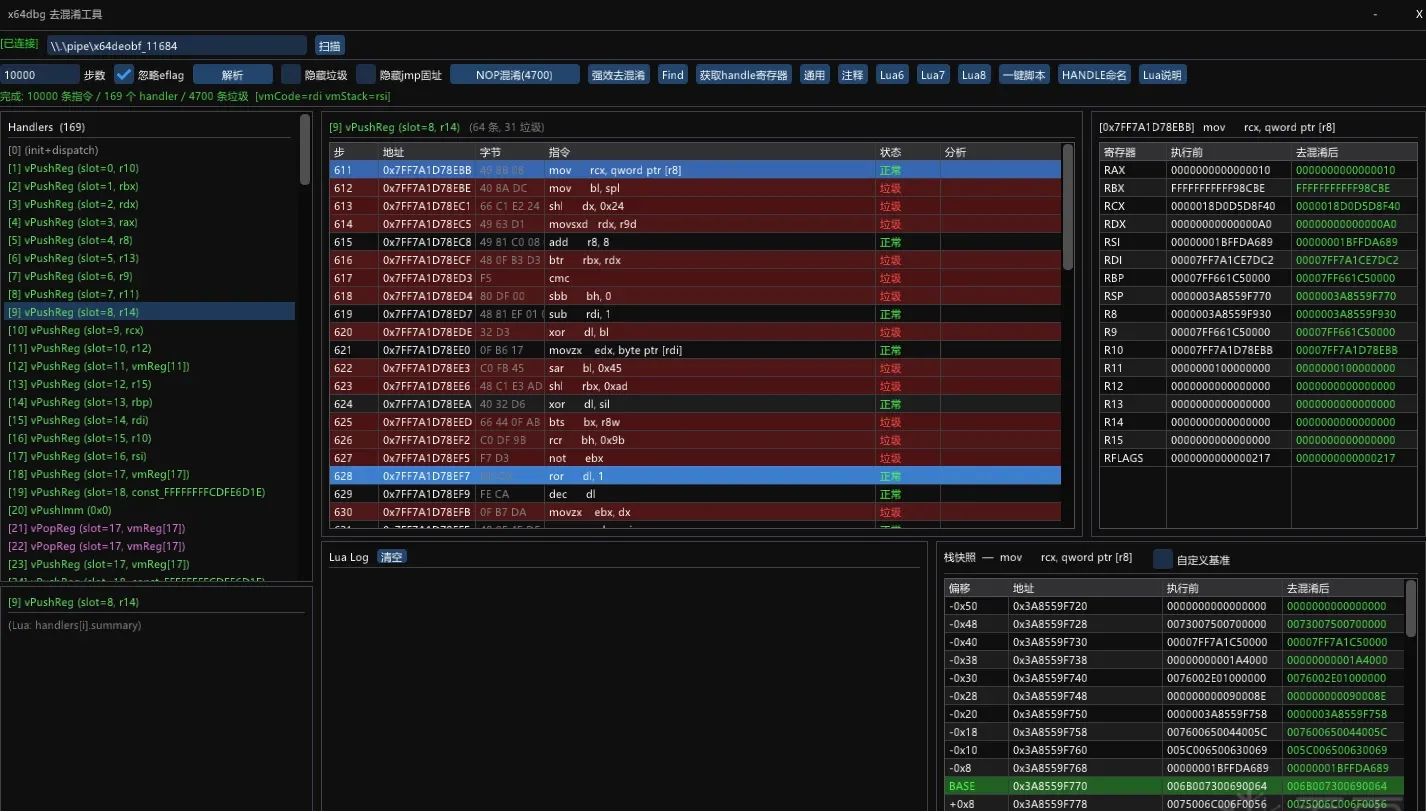
The UI’s marked regions:
- Select the x64dbg instance to attach to.
- Run various Lua scripts.
- Show parsed handlers.
- Show the handler’s disassembly — instructions in red are classified as obfuscation.
- Register state obtained by executing the assembly under Unicorn, showing both the raw result and the de-obfuscated result. Comparing the two lets you confirm that only dead instructions were removed.
- Log output.
- Stack state captured during execution.
- Per-handler log (switching handlers in the UI switches the log).
Setting up a target
I wrote a minimal x64 function to virtualize. Since 64-bit MSVC has no inline assembly without a plugin, I put it in a separate .asm file — nothing but push/pop/sub/add/mov:
.code

; rcx = buf (passed from main, Windows x64 ABI first arg)
pushtest PROC

    push rax

    mov  rax, 12345679h
    mov  rax, 12345678h
    add  rcx ,1
    mov  qword ptr [rcx], rax

    sub  rcx ,1
    pop rax

    mov  byte ptr [rcx], 0ABh

    mov  dword ptr [rcx+1], 0DEADBEEFh

    mov  rcx, 123456789ABCDEFh

    ret

pushtest ENDP

END
I compiled VMP 3.5.1 from source I had on hand (irrelevant to the analysis itself — it’s just the version I had). When packing, I selected only pushtest and disabled every protection so we isolate virtualization:
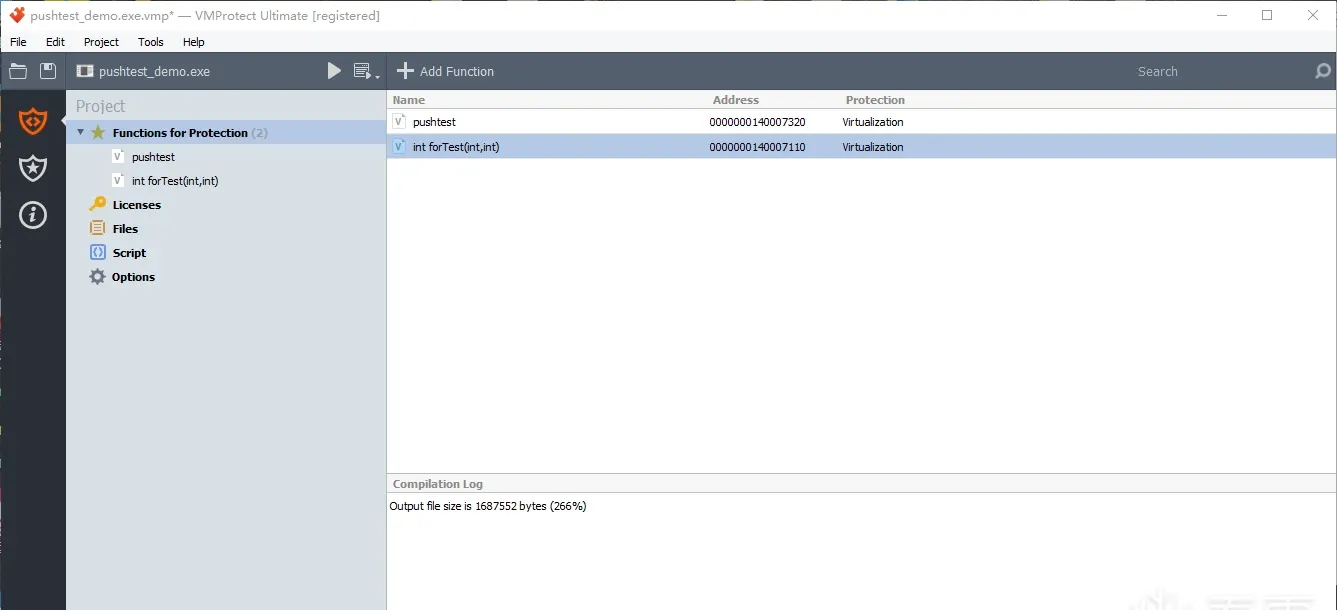
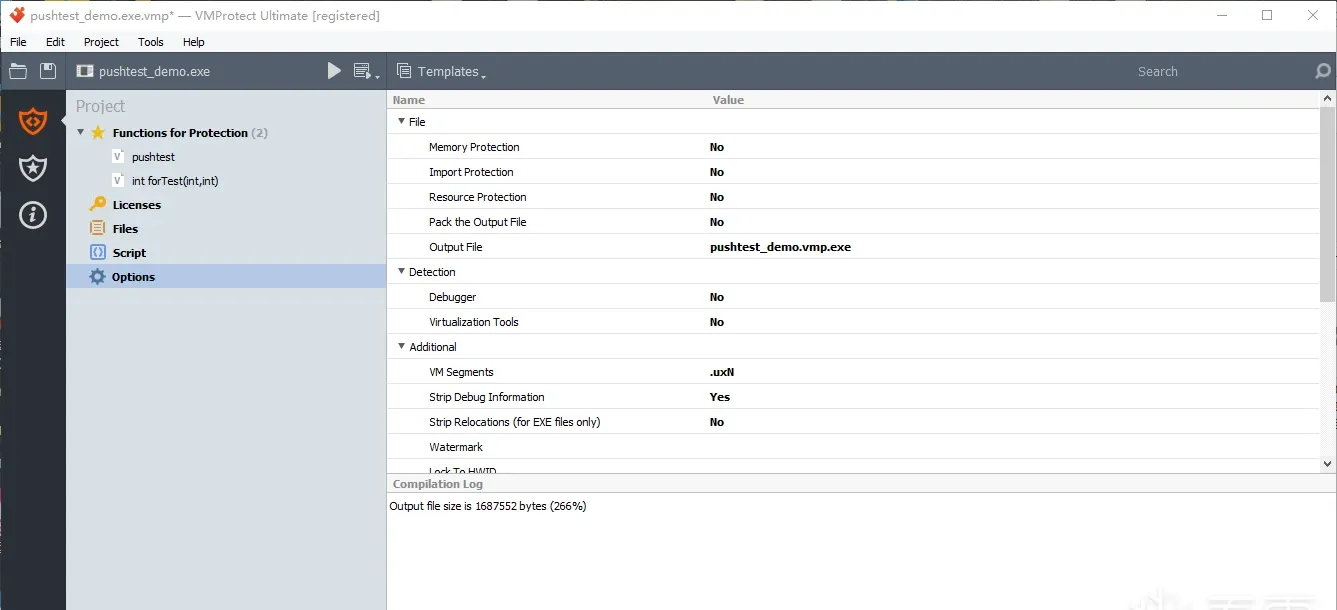
Finding the VM entry point
VMP virtualizes a function by replacing its entry point. So find the original call site and you find the VM entry.
Before packing, the call site:
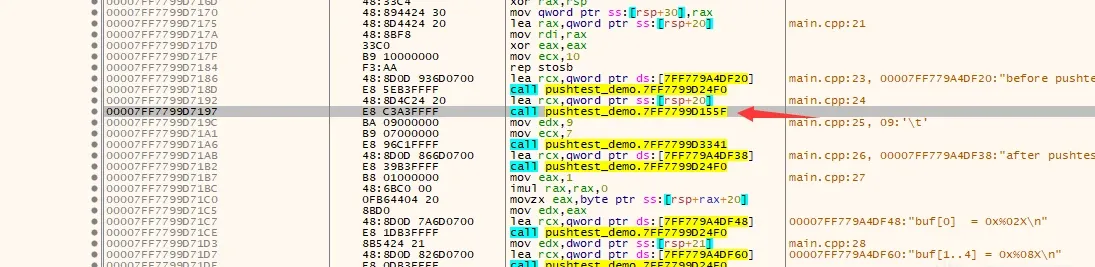
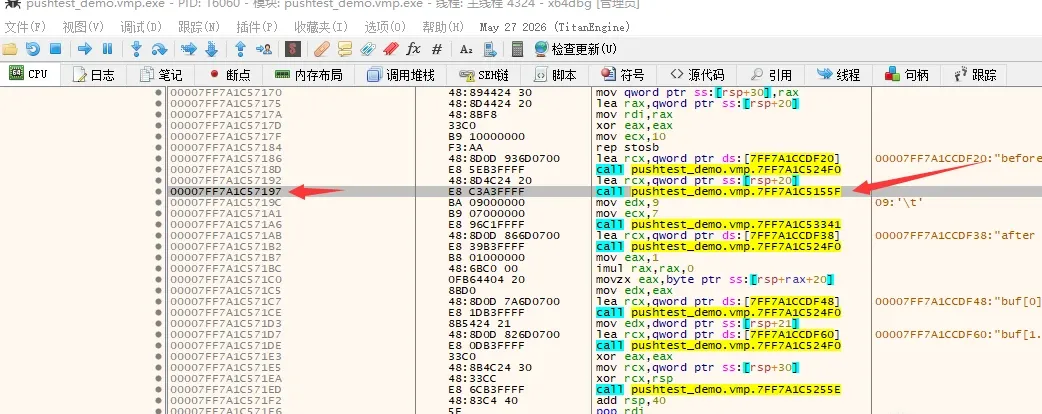
After packing, the call’s address is unchanged (base address + fixed offset) — stepping in lands at the VM entry:
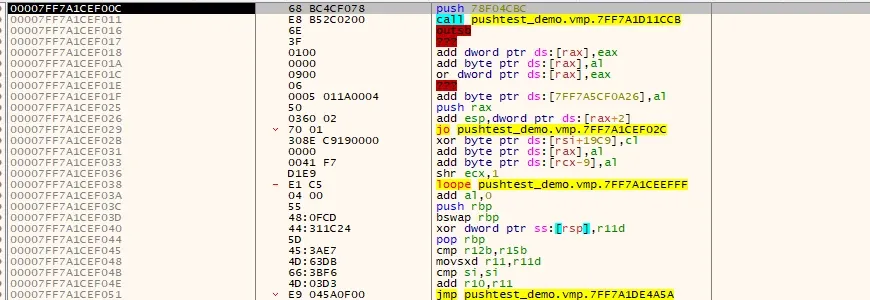
The VM entry has a recognizable signature — push followed by call:
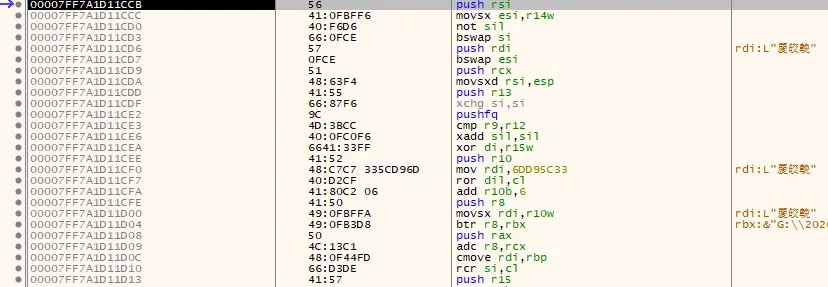
A few jumps inward is the VM initialization:
The de-obfuscation pipeline
The pipeline has three stages.
Stage 1: dynamic trace
The core is Unicorn emulation with on-demand memory mapping.
- Read the target process’s register snapshot and memory pages from x64dbg over IPC.
- Initialize Unicorn, write registers and the memory pages we already have.
- Register two hooks:
cb_code: before every instruction, record the address, a register snapshot (16 GPRs + RFLAGS), and a stack snapshot (a few slots above and below RSP).cb_unmapped: when an unmapped page is hit, read and map it from x64dbg in real time (on-demand loading).
- Run until the step limit, producing a
TraceEntry[]sequence.
Stage 2: PCode semantic translation (Sleigh)
Next, each x86 instruction is lifted into Ghidra Sleigh PCode atomic operations. Every instruction becomes several PCode operations (RawOp), each with:
opc: the opcode (COPY,INT_ADD,LOAD,STORE,BRANCH,CBRANCH, …).out: the output varnode (space + offset + size).ins[]: the input varnode list.dead: whether dead-code elimination has marked it.
Varnode address spaces:
register: CPU registers (offset is the Ghidra register number, e.g.rax=0x00,rcx=0x08,rsp=0x20).const: immediate constants.unique: Sleigh temporaries (intermediate results within an instruction).ram: the memory address space.
For example, mov r11, [rsp+0x90] lifts to:
INT_ADD  unique:tmp = register:rsp + const:0x90
LOAD     unique:tmp2 = [ram: unique:tmp]
COPY     register:r11 = unique:tmp2
Stage 3: dead-code elimination
This is the critical step — a backwards liveness analysis plus a RuleVmpEarlyRemoval pass.
Backwards liveness analysis outperformed the forward version in testing. Scan from the end of a handler segment backwards, maintaining a live set of currently-live varnodes:
- Initial state: all 16 GPRs are live (registers must be consistent at the handler exit). EFLAGS bits are not pre-marked.
- Scanning rules:
- Operations with side effects (
STORE,BRANCH,CBRANCH,CALL,RET): add all inputs tolive. - Writes to
ram: add all inputs tolive. - Writes to
register/unique:- If the output is in
live→ remove the output, add all inputs (liveness propagation). - If the output is not in
live→ mark itdead(nobody uses this operation; it’s garbage).
- If the output is in
- Operations with side effects (
CBRANCH special case: since the Unicorn trace already fixed the taken path, a CBRANCH degenerates to an unconditional branch. We therefore don’t propagate the flag inputs’ liveness — this avoids misclassifying a large class of flag-computation instructions (one of VMP’s main obfuscation tools) as live.
That introduces a known problem: when a real jz/jnz shows up, ignoring the flags means Unicorn may follow branch A and de-obfuscate correctly this run, but branch B breaks on the next run. Resolving that is a matter of refining the elimination rules over time.
Results
From here, a “handler” means a bundle of assembly that implements a virtual-machine operation (or PCode semantics) inside the VM. Red instructions are all obfuscation.
Handler 9:
Handler 10:
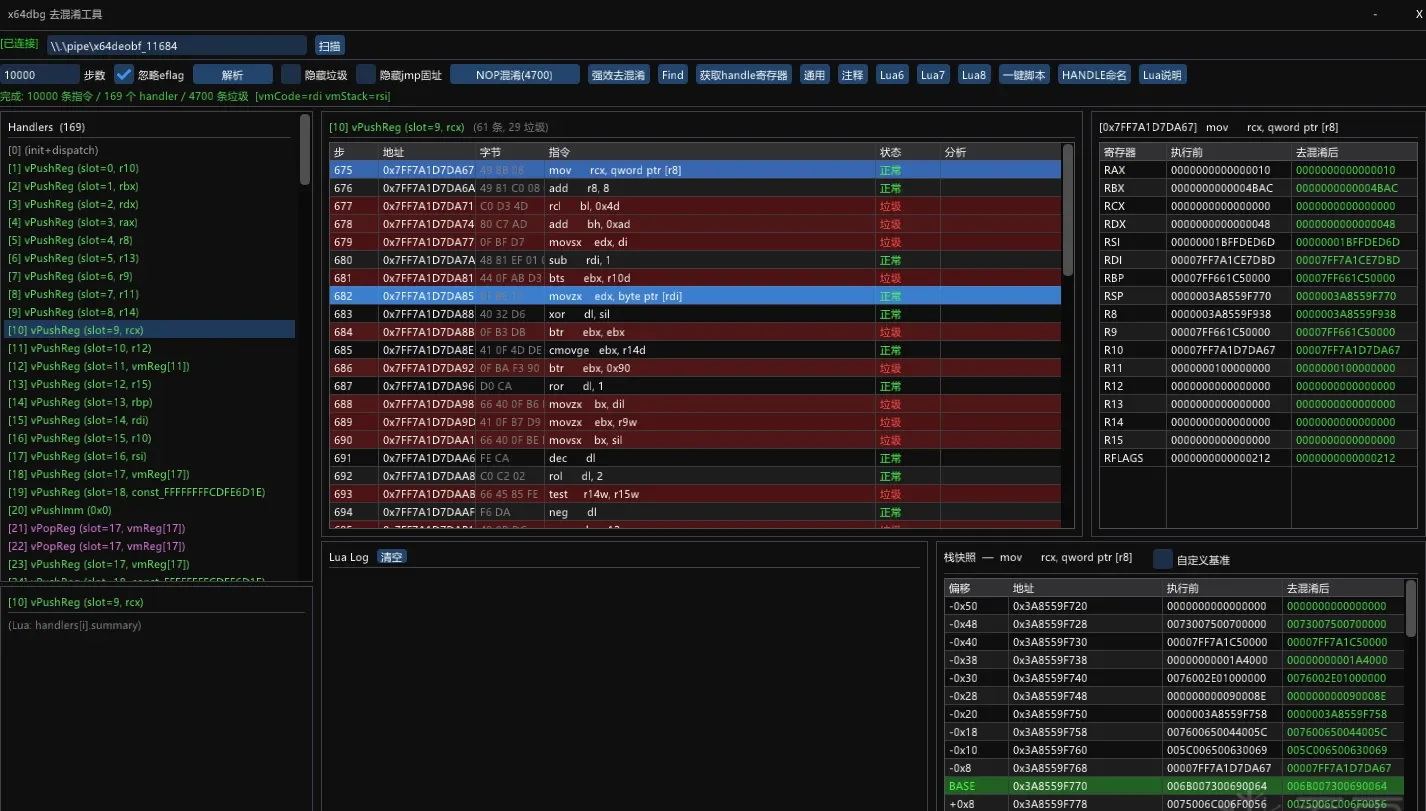
Handler 9 after de-obfuscation:
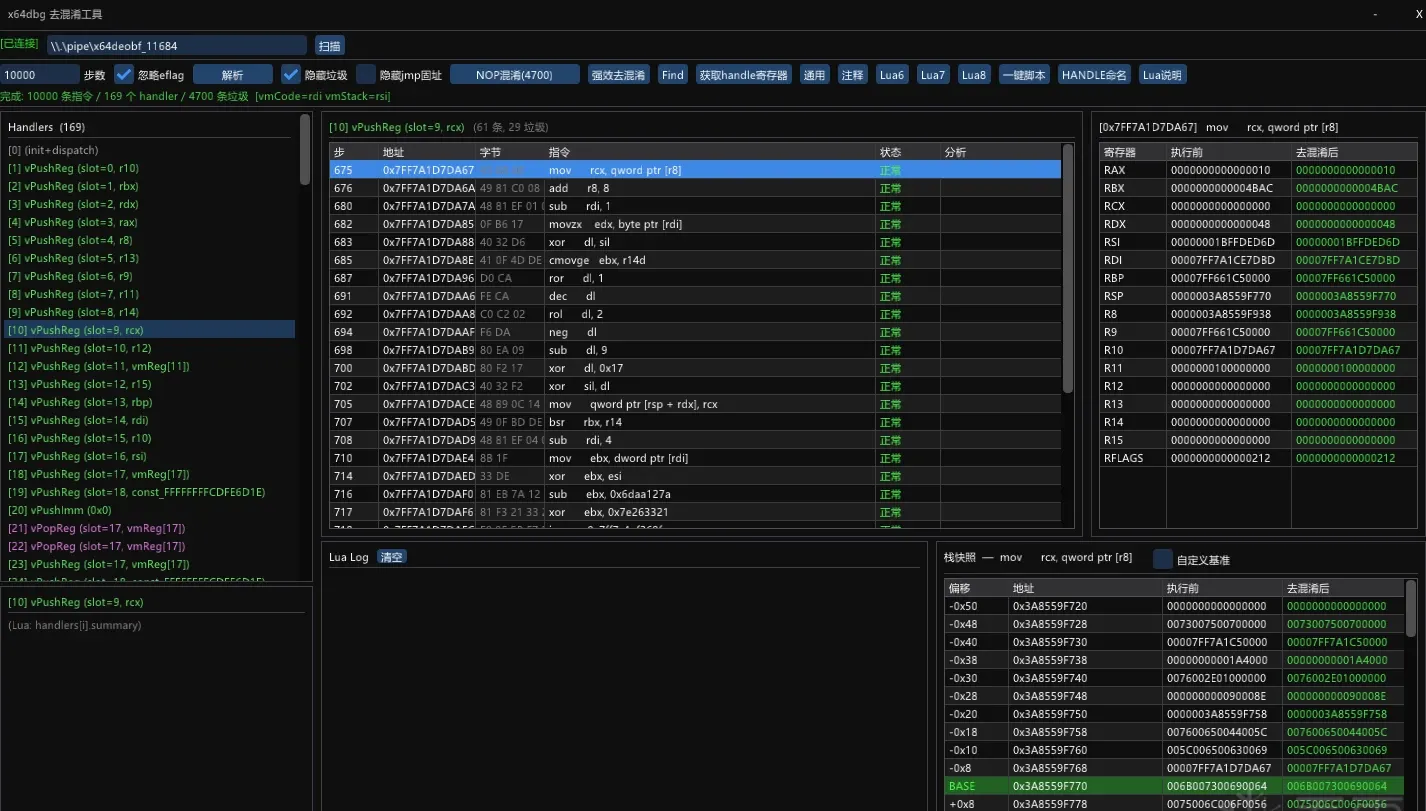
Handler 10 after de-obfuscation:
Compare them: handlers 9 and 10 are nearly identical. The instructions that still differ are obfuscation that wasn’t fully removed — a signal to keep refining the elimination logic. If a differing instruction is an immediate, it may be pre-encryption data or something else; I won’t claim certainty yet. The takeaway is that handlers of the same class are nearly identical — VMP deliberately keeps several handlers for the same operation to raise the analysis difficulty. This is exactly why de-obfuscation must come first: without it, the handler boundaries are hard to see, the features are hard to fingerprint, and the patterns never emerge.
What VMP’s VM actually does at entry
What I’ve established so far is that VMP’s virtualization saves the entire execution context, operates on it through custom instructions, then restores it. A simple illustration: mov rax, 1 can be rewritten as:
push rax
mov  [rsp+8], 1
pop  rax
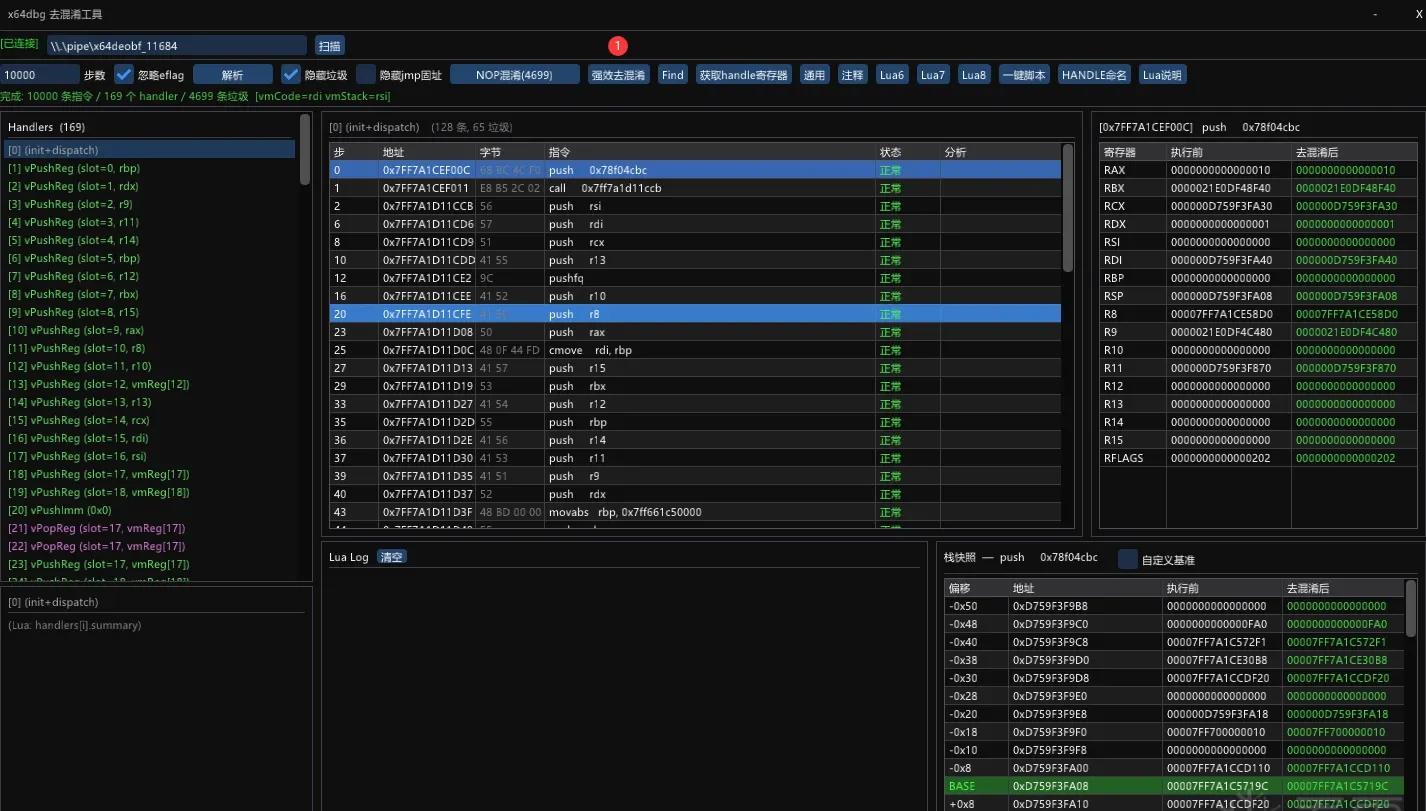
So the first thing the virtual machine must do is save the context. Here is the VM entry after de-obfuscation — a wall of pushes:
(One instruction at line 25 sticks out — de-obfuscation is still incomplete there. A stronger elimination pass helps, but it can overshoot, so it’s a judgment call.)
That’s as far as the virtual-machine reconstruction goes for now. The full handler walkthrough deserves its own installment, but the de-obfuscation pipeline above is the reusable part: trace first to fix control flow, lift to PCode to expose semantics, then eliminate dead operations by backwards liveness — verifying each step by re-running the emulation and diffing register state.
Reading about it only gets you so far; the methodology only sticks once you run it against your own target.
Colin Xiao — I take on contract reverse-engineering work, and writeups like this are how I show what I can do. If you need help with anything in this space — including but not limited to the areas I cover above — I’m available. No project is too big or too small — if it’s reverse engineering and I can do it, I’ll take it. DM me on X (@colinxiao_lab) or Telegram (@ColinXiao666).
Get in touch