Custom bcc/eBPF: Dwarf-Based Userspace Stack Unwinding on Android
About the author. I’m Colin Xiao — an independent reverse engineer, mostly working solo on contract jobs. I dig into compiled code of every kind, including but not limited to: Android and iOS apps, x86/x64/ARM native binaries, packers and obfuscators, DRM and license checks, network protocols and APIs, crypto and signature algorithms, malware, game binaries, and embedded/IoT firmware. I also handle large-scale data collection and vulnerability research. If you have any project in mind, I’d be glad to take it on — whatever it is, as long as it’s within my wheelhouse. Just reach out. You can reach me on X at @colinxiao_lab or on Telegram at https://t.me/ColinXiao666.
This research is published for educational and defensive purposes. The target sample is anonymized throughout.
Custom bcc/eBPF: Dwarf-Based Userspace Stack Unwinding on Android
eBPF is a very powerful kernel-level tracing mechanism — useful not just for performance analysis but also as a powerful tool in reverse engineering. For an introductory article, see evilpan’s writeup on Linux kernel monitoring in Android attack/defense.
bcc is the most famous high-level wrapper around it. This article provides a scheme for customizing bcc’s source to implement dwarf-based userspace stack unwinding on Android, and discusses the underlying code principles and mechanisms.
First, the questions to raise: what form of stack unwinding does bcc/eBPF provide? What are its drawbacks, and what principle is it based on?
Stack unwinding comes in two flavors: frame-pointer (fp) based and dwarf-based. DWARF (Debugging With Attributed Record Formats) is the file format many compilers and debuggers use to support source-level debugging. DWARF debug info lives in the .debug_frame section or the .eh_frame section; .eh_frame is defined by modern Linux in the LSB (Linux Standard Base) standard. .debug_frame isn’t loaded into memory, but .eh_frame is. There are plenty of articles on stack unwinding online, so I won’t belabor it here.
Environment: Pixel 3 XL, Linux kernel 4.9, AOSP 10. eBPF is a fast-moving technology — the newer the kernel, the richer the features; 4.9 is actually fairly old. The bcc version used is the latest at the time (2022-08-11 release) v0.25.0.
Part 1. The bcc environment
bcc is built and run in a self-made Debian 10 arm64 image created with debootstrap, pushed to the phone with the adeb tool, and run in a lightweight containerized chroot environment where the build tools are installed.
Compiling an eBPF program needs kheaders, otherwise you get:
Unable to find kernel headers. Try rebuilding kernel with CONFIG_IKHEADERS=m (module) or installing the kernel development package for your running kernel version.The official recommendation is to build the kernel with CONFIG_IKHEADERS, but that option doesn’t exist on 4.9. In fact, after building the official android-msm-crosshatch-4.9 kernel, a kheader file is produced:
out/android-msm-pixel-4.9/dist/kernel-headers.tar.gzPush it to the phone and extract to /tmp/kheaders-uname -r`` — bcc reads this directory as kheaders; the logic is in get_proc_kheaders called by loader.cc.
Part 2. Userspace stack unwinding in bcc
eBPF can easily print syscall arguments; if it can also print the stack at the same time, it’s extremely useful for debugging and reverse engineering — e.g. which code path opened a file, which .so opened a network connection, to which address and port, and so on. Most importantly, it’s non-intrusive: no matter how you obfuscate, all your syscalls can be traced.
bcc’s trace.py provides the -U option to print the userspace stack.
First prepare a small program; libnative-lib.so has:
void func_a(int arg) {
    __android_log_print(ANDROID_LOG_INFO, LOG_TAG, "func_a: %d", arg);
    func_b("test");
}

void func_b(std::string arg) {
    __android_log_print(ANDROID_LOG_INFO, LOG_TAG, "func_b: %s", arg.c_str());
    func_c(10.0f);
}

void func_c(float arg) {
    __android_log_print(ANDROID_LOG_INFO, LOG_TAG, "func_c: %f", arg);
    func_d(true);
}

void func_d(bool arg) {
    __android_log_print(ANDROID_LOG_INFO, LOG_TAG, "func_d: %d", arg);
    func_e(10.0f);
}

void func_e(double arg) {
    int fd;
    fd = open("/data/local/tmp/test", O_RDONLY);
    __android_log_print(ANDROID_LOG_INFO, LOG_TAG, "args is %f, fd is : %d", arg, fd);
    close(fd);
}
Simple: it creates a thread via pthread_create and calls down from func_a to func_e, where it opens /data/local/tmp/test.
Run trace.py to trace the program’s (uid 10121) do_sys_open:
python3 trace --uid 10121 'do_sys_open "%s", arg2@user' -U --address -vIt prints some call info, but the result isn’t great:
5791   5791   com.mypack.test   do_sys_open      b'/proc/self/task/12421/comm'
              74f7854388 __openat+0x8 [libc.so]
              7465f59d28 [unknown]
              7fd4be9740 [unknown]

5791    5843    test_unwind     do_sys_open      b'/data/local/tmp/test'
              7e1b223388 __openat+0x8 [libc.so]
              7d8a34ec58 [unknown] [base.apk]
              7d8a34ec00 [unknown] [base.apk]
              7d8a34eac0 [unknown] [base.apk]
              7d8a34ea14 [unknown] [base.apk]
              7d8a34edb8 [unknown] [base.apk]
              7e1b237b44 __pthread_start(void*)+0x28 [libc.so]
              7e1b1da2d4 __start_thread+0x44 [libc.so]
Stack unwinding really has two parts: getting the call stack and symbolizing it. The first dump is missing most info. The second is the stack of func_a’s open of /data/local/tmp/test — the stack looks okay but symbolization failed: every symbol is unknown, the call site is shown in base.apk rather than libnative-lib.so, and the addresses shown are runtime addresses. If we could show the offset within the .so instead, it’d be much better for IDA analysis. Where’s the cause? We have to dig into the source.
Part 3. How bcc works
First, the framework diagram from Brendan Gregg’s site:
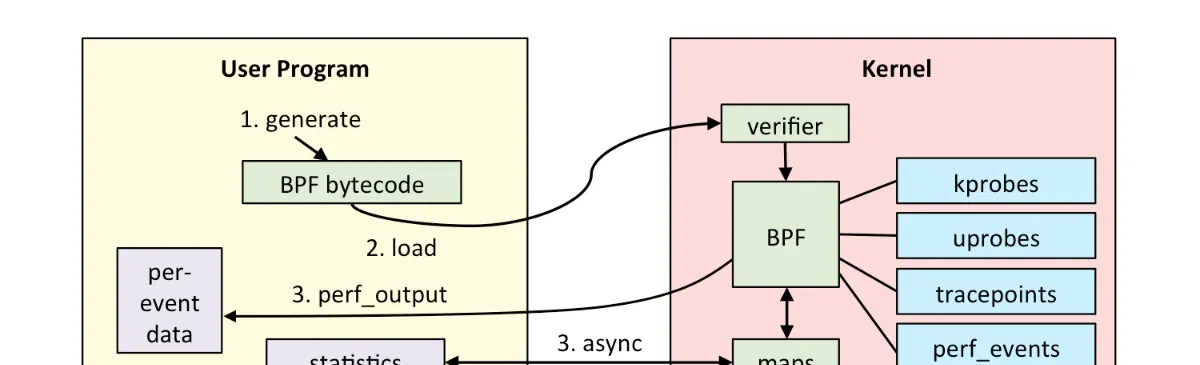
Figure 1 — bcc framework
bcc provides a Python frontend; Python talks to the C/C++ backend, calls LLVM to compile the eBPF bytecode, and calls the bpf syscall; after passing the verifier, the code is JIT’d into executable form. To actually run, the eBPF program must attach to a kernel trace/event; when the event fires, the eBPF program runs, and communicates with userspace via bpf maps or perf_output. Userspace reads the generated data after the eBPF program runs — so userspace reads asynchronously.
The perf_output used by eBPF is the key to this article’s dwarf-based userspace stack unwinding.
Look at Lesson 7. hello_perf_output.py in bcc’s docs/tutorial_bcc_python_developer.md:
from bcc import BPF

# define BPF program
prog = """
#include <linux/sched.h>

// define output data structure in C
struct data_t {
    u32 pid;
    u64 ts;
    char comm[TASK_COMM_LEN];
};
BPF_PERF_OUTPUT(events);

int hello(struct pt_regs *ctx) {
    struct data_t data = {};

    data.pid = bpf_get_current_pid_tgid();
    data.ts = bpf_ktime_get_ns();
    bpf_get_current_comm(&data.comm, sizeof(data.comm));

    events.perf_submit(ctx, &data, sizeof(data));

    return 0;
}
"""

# load BPF program
b = BPF(text=prog)
b.attach_kprobe(event=b.get_syscall_fnname("clone"), fn_name="hello")

# header
print("%-18s %-16s %-6s %s" % ("TIME(s)", "COMM", "PID", "MESSAGE"))

# process event
start = 0
def print_event(cpu, data, size):
    global start
    event = b["events"].event(data)
    if start == 0:
            start = event.ts
    time_s = (float(event.ts - start)) / 1000000000
    print("%-18.9f %-16s %-6d %s" % (time_s, event.comm, event.pid,
        "Hello, perf_output!"))

# loop with callback to print_event
b["events"].open_perf_buffer(print_event)
while 1:
    b.perf_buffer_poll()
This program traces the clone syscall and prints the call time, the caller’s process name, and pid.
Note the string code in prog is C code, compiled later by LLVM; everything else is Python. The C function hello is the eBPF program that ultimately runs in the kernel, attached as a kprobe to sys_clone.
The other code in prog besides hello is helper code, unifying the eBPF output with the input data structures the Python side reads; it isn’t included in the finally loaded eBPF program. For example, BPF_PERF_OUTPUT(events) defines the perf buffer the eBPF program outputs to; the Python side uses b["events"] to associate the same buffer and read structured struct data_t data.
The eBPF program includes headers so clang compiles it, and so it can load into a kernel with a consistent API.
Actually events.perf_submit(ctx, &data, sizeof(data)) in hello isn’t legal eBPF; eBPF bytecode is strictly limited:
- Only 512 bytes of stack space.
- Can’t call arbitrary kernel functions — only predefined bpf helpers or tail-call other bpf programs.
- Program size is limited.
- Loops are forbidden.
All these limits guarantee system safety/stability, since bpf programs run in the kernel and a bug would crash the whole system.
Ultimately events.perf_submit(ctx, &data, sizeof(data)) is replaced with a bpf helper by clang rewriting the compiled program’s AST.
Analyzing the program
b = BPF(text=prog): — you can add a debug parameter:
b = BPF(text=prog, debug=DEBUG_PREPROCESSOR|DEBUG_SOURCE),to print the preprocessed source and disassembled eBPF. After preprocessing, some macros are added up front:
#if defined(BPF_LICENSE)
#error BPF_LICENSE cannot be specified through cflags
#endif
#if !defined(CONFIG_CC_STACKPROTECTOR)
#if defined(CONFIG_CC_STACKPROTECTOR_AUTO) \
    || defined(CONFIG_CC_STACKPROTECTOR_REGULAR) \
    || defined(CONFIG_CC_STACKPROTECTOR_STRONG)
#define CONFIG_CC_STACKPROTECTOR
#endif
#endif
#define bpf_probe_read_kernel bpf_probe_read
#define bpf_probe_read_kernel_str bpf_probe_read_str
#define bpf_probe_read_user bpf_probe_read
#define bpf_probe_read_user_str bpf_probe_read_str
And at the end: #include <bcc/footer.h>.
hello gains __attribute__((section(".bpf.fn.hello"))) to place the output in section .bpf.fn.hello.
And events.perf_submit(ctx, &data, sizeof(data)) becomes the bpf helper bpf_perf_event_output(ctx, bpf_pseudo_fd(1, -1), CUR_CPU_IDENTIFIER, &data, sizeof(data)); — the bpf_pseudo_fd(1, -1) argument is still a pseudo-argument, processed later.
Back to b = BPF(text=prog), which mainly:
- Compiles the bpf program.
- Loads the bpf program.
- Attaches the bpf program.
1. Compiling the bpf program
In Python the bpf program is the BPF class; in C/C++ it’s ebpf::BPFModule. They’re linked via Python’s ctypes (a jni-like mechanism): the Python BPF class loads libbcc.so.0 and calls bpf_module_create_c_from_string() to create an ebpf::BPFModule object.
ebpf::BPFModule’s constructor initializes the LLVM environment:
  initialize_rw_engine();
  LLVMInitializeBPFTarget();
  LLVMInitializeBPFTargetMC();
  LLVMInitializeBPFTargetInfo();
  LLVMInitializeBPFAsmPrinter();
#if LLVM_MAJOR_VERSION >= 6
  LLVMInitializeBPFAsmParser();
  if (flags & DEBUG_SOURCE)
    LLVMInitializeBPFDisassembler();
#endif
  LLVMLinkInMCJIT(); /* call empty function to force linking of MCJIT */
Then ebpf::BPFModule::load_string() compiles, summarized:
- Compiling needs kheaders; find the kheaders path — usually
/lib/moduleson Linux distros,/proc/kheaders.tar.xzonCONFIG_IKHEADERS=mkernels, else/tmp/kheaders-uname -r``. - Assemble clang’s compile flags into
flags_cstr. Since-emit-llvmis set, the output is LLVM IR. Note some options use virtual files:-include /virtual/include/bcc/bpf_workaround.h -include /virtual/include/bcc/helpers.h, virtual target/virtual/main.c, and-Ipointing at the kheaders directory. - Initialize the clang compile library and preprocess:
clang::CompilerInvocation::getPreprocessorOpts().addRemappedFile()remaps the virtual files to real files;/virtual/main.cmaps to anllvm::MemoryBufferof the in-memory source. - Three rounds of AST processing:
TracepointFrontendAction,BFrontendAction,EmitLLVMOnlyAction. These transform source;BFrontendActionis quite complex, handling many types — understanding it requires deep familiarity with clang’s API and AST. But you can print the processed source and just look at your program’s handling.BFrontendActionhas one important step:Catch the map declarations and open the fd's. - This yields an
llvm::ModuleIR; thenfinalize()compiles the IR into a bpf program and runs the PassManager to inline the functions. The compiled instructions live inprog_func_info_; aFuncInforepresents each compiled function, with its instructions atFuncInfo::start_. - Calls
load_mapsto create bpf maps via the bpf syscall.
Focus on step 6, load_maps. hello_perf_output.py has BPF_PERF_OUTPUT(events);. BPF_PERF_OUTPUT is a macro in src/cc/export/helpers.h; BPF_PERF_OUTPUT(events) is equivalent to:
struct events_table_t {
  int key;
  u32 leaf;
  /* map.perf_submit(ctx, data, data_size) */
  int (*perf_submit) (void *, void *, u32);
  int (*perf_submit_skb) (void *, u32, void *, u32);
  u32 max_entries;
};
__attribute__((section("maps/perf_output")))
struct events_table_t events = { .max_entries = 0 }
__attribute__((section("maps/perf_output"))) sets the section to maps/perf_output; BFrontendAction scanning this attribute generates a fake map id and stores it in fake_fd_map_. The map type is BPF_MAP_TYPE_PERF_EVENT_ARRAY; the key size matches events_table_t’s key (int), the value size matches leaf (u32), and max_entries is the CPU count.
When load_maps runs at step 6, it iterates fake_fd_map_ and calls the bpf syscall; a simplified call looks like:
union bpf_attr attr = {
    .map_type    = BPF_MAP_TYPE_PERF_EVENT_ARRAY,
    .key_size    = sizeof(int),
    .value_size  = sizeof(u32),
    .max_entries = get_possible_cpus().size(),
    .map_name = "events",

};
int bpf_map_fd = bpf(BPF_MAP_CREATE, &attr, sizeof(attr));
Summary:
- Compile the bpf program; the result is stored in
BPFModule::prog_func_info_. - Because of
BPF_PERF_OUTPUT(events);, a bpf map of typeBPF_MAP_TYPE_PERF_EVENT_ARRAYis created via the bpf syscall.
2. Loading the bpf program
Calls the bpf syscall with BPF_PROG_LOAD to load the compiled eBPF program into the kernel.
3. Attaching the bpf program
After loading, attach it as a kprobe to sys_clone. Attaching relies on existing kernel mechanisms: perf or ftrace.
bcc prefers the perf perf_event_open syscall; if it fails, it falls back to ftrace. The perf attach call:
perf_event_attr attr;
attr.sample_period = 1;
attr.wakeup_events = 1;
attr.config |= (0 << 32);
attr.config2 = 0;
attr.size = sizeof(attr);
attr.type = type;   //cat /sys/bus/event_source/devices/kprobe/type
attr.config1 = ptr_to_u64((void *)"sys_clone");
int pfd = perf_event_open(&attr,-1,0,-1,PERF_FLAG_FD_CLOEXEC)
ioctl(pfd, PERF_EVENT_IOC_SET_BPF, progfd);//progfd is bpf(BPF_PROG_LOAD)'s return
This is the first time perf_event_open shows up; this article’s dwarf userspace stack unwinding is based on it.
If perf fails, ftrace is used: write the attach string to /sys/kernel/debug/tracing/kprobe_events.
Executing the bpf program and getting data
events.perf_submit(ctx, &data, sizeof(data)) was replaced with bpf_perf_event_output(ctx, bpf_pseudo_fd(1, -1), CUR_CPU_IDENTIFIER, &data, sizeof(data)).
bpf_perf_event_output’s second parameter is struct bpf_map *map, but here it’s bpf_pseudo_fd(1, -1). Look at the generated bytecode:
; bpf_perf_event_output(ctx, bpf_pseudo_fd(1, -1), CUR_CPU_IDENTIFIER, &data, sizeof(data)); // Line 35
14: 18 12 00 00 ff ff ff ff 00 00 00 00 00 00 00 00 ld_pseudo r2, 1, 4294967295
BPFModule::load_maps rewrites bpf_pseudo_fd(1, -1)-style instructions, replacing the immediate with the bpf map fd for events — i.e. the bpf_map_fd above.
Why is the second parameter struct bpf_map *map but we pass a file descriptor? When loading, the kernel’s verifier.c calls replace_map_fd_with_map_ptr to map the bpf_map_fd to bpf_map *.
bpf_map is like a base class; maps have many types — BPF_MAP_TYPE_PERF_EVENT_ARRAY, BPF_MAP_TYPE_HASH, BPF_MAP_TYPE_PERCPU_ARRAY. For BPF_MAP_TYPE_PERF_EVENT_ARRAY, the actual kernel data structure is bpf_array, which contains a bpf_map.
Though bpf(BPF_MAP_CREATE, ...) created a BPF_MAP_TYPE_PERF_EVENT_ARRAY map, it isn’t tied to actual perf storage, so nothing can be written yet — userspace must call perf_event_open() to associate perf with the bpf map. See how: in the Python, b["events"].open_perf_buffer(print_event) does:
- Find
events’ bpf_map_fd by name, create aPerfEventArray, and call itsopen_perf_buffer, withprint_eventas the data callback. PerfEventArray::open_perf_buffercallsperf_event_openfor each online CPU:
struct perf_event_attr attr = {};
attr.config = 10;//PERF_COUNT_SW_BPF_OUTPUT;
attr.type = PERF_TYPE_SOFTWARE;
attr.sample_type = PERF_SAMPLE_RAW;
attr.sample_period = 1;
attr.wakeup_events = opts->wakeup_events;
pfd = syscall(__NR_perf_event_open, &attr, pid, cpu, -1, PERF_FLAG_FD_CLOEXEC);
perf_event_open is a fairly complex syscall with many configuration options.
3. mmap the pfd into userspace to read perf records from the kernel.
4. ioctl(pfd, PERF_EVENT_IOC_ENABLE, 0) enables the event.
5. Back in table.py’s _open_perf_buffer: self[self.Key(cpu)] = self.Leaf(fd) associates all perf events with the bpf map — actually calling bpf(BPF_MAP_UPDATE_ELEM) to update the map’s key-value pairs: key is the CPU index, value is perf_event_open’s return.
Once the bpf map and perf events are associated, when clone fires, the bpf program calls bpf_perf_event_output to write to the perf event tied to the map; bcc reads it via the mmap’d perf memory and calls the Python print_event callback.
Now perf_event_open: its configuration is very complex and its returns are varied. Originally it was a performance-monitoring syscall — modern CPUs have a PMU (performance monitoring unit) with hardware counters for events like clock cycles, instructions executed, cache misses. The kernel wraps these counters as hardware perf events, plus hardware-independent software perf events, which grew over time — e.g. the bpf-related software event PERF_COUNT_SW_BPF_OUTPUT.
Perf events have two modes: counting and sampling. Setting sample_period is sampling mode:
static inline bool is_sampling_event(struct perf_event *event)
{
	return event->attr.sample_period != 0;
}
In sampling mode, every so many samples, event info is written to a ring buffer shared with userspace, which reads it via mmap. As seen above, perf_event_open (the perf_kprobe PMU) is used both to attach eBPF programs and to communicate between eBPF and userspace — high efficiency, and bcc’s recommended channel.
Part 4. trace.py’s stack printing
trace.py auto-generates a bpf program from the arguments:
#include <linux/ptrace.h>
#include <linux/sched.h>        /* For TASK_COMM_LEN */


struct probe_do_sys_open_1_data_t
{


        u32 tgid;
        u32 pid;
        char comm[TASK_COMM_LEN];
        char v0[80];


       int user_stack_id;
        u32 uid;
};

BPF_PERF_OUTPUT(probe_do_sys_open_1_events);
BPF_STACK_TRACE(probe_do_sys_open_1_stacks, 1024);

int probe_do_sys_open_1(struct pt_regs *ctx)
{
        u64 __pid_tgid = bpf_get_current_pid_tgid();
        u32 __tgid = __pid_tgid >> 32;
        u32 __pid = __pid_tgid; // implicit cast to u32 for bottom half
        u32 __uid = bpf_get_current_uid_gid();

        if (__tgid == 22803) { return 0; }


        if (__uid != 10121) { return 0; }


        if (!(1)) return 0;

        struct probe_do_sys_open_1_data_t __data = {0};


        __data.tgid = __tgid;
        __data.pid = __pid;
        __data.uid = __uid;
        bpf_get_current_comm(&__data.comm, sizeof(__data.comm));

        if (PT_REGS_PARM2(ctx) != 0) {
                void *__tmp = (void *)PT_REGS_PARM2(ctx);
                bpf_probe_read_user(&__data.v0, sizeof(__data.v0), __tmp);
        }


        __data.user_stack_id = probe_do_sys_open_1_stacks.get_stackid(
          ctx, BPF_F_USER_STACK
        );
        probe_do_sys_open_1_events.perf_submit(ctx, &__data, sizeof(__data));
        return 0;
}
After processing:
__data.user_stack_id = probe_do_sys_open_1_stacks.get_stackid(ctx, BPF_F_USER_STACK);
probe_do_sys_open_1_events.perf_submit(ctx, &__data, sizeof(__data));
becomes:
__data.user_stack_id = bpf_get_stackid(ctx,bpf_pseudo_fd(1, -2),  BPF_F_USER_STACK);
bpf_perf_event_output(ctx, bpf_pseudo_fd(1, -1), CUR_CPU_IDENTIFIER, &__data, sizeof(__data));
bpf_perf_event_output flows the same as in hello_perf_output.py; the new part is bpf_get_stackid(), also a bpf helper.
Look at BPF_STACK_TRACE(probe_do_sys_open_1_stacks, 1024);. The BPF_STACK_TRACE macro is also in src/cc/export/helpers.h, expanding to:
struct probe_do_sys_open_1_stacks_table_t {
  int key;
  struct bpf_stacktrace leaf;
  struct bpf_stacktrace * (*lookup) (int *);
  struct bpf_stacktrace * (*lookup_or_init) (int *, struct bpf_stacktrace *);
  struct bpf_stacktrace * (*lookup_or_try_init) (int *, struct bpf_stacktrace *);
  int (*update) (int *, struct bpf_stacktrace *);
  int (*insert) (int *, struct bpf_stacktrace *);
  int (*delete) (int *);
  void (*call) (void *, int index);
  void (*increment) (int, ...);
  void (*atomic_increment) (_key_inttype, ...);
  int (*get_stackid) (void *, u64);
  void * (*sk_storage_get) (void *, void *, int);
  int (*sk_storage_delete) (void *);
  void * (*inode_storage_get) (void *, void *, int);
  int (*inode_storage_delete) (void *);
  void * (*task_storage_get) (void *, void *, int);
  int (*task_storage_delete) (void *);
  u32 max_entries;
  int flags;
};
__attribute__((section("maps/stacktrace")))
struct probe_do_sys_open_1_stacks_table_t probe_do_sys_open_1_stacks = { .flags = (0), .max_entries = (roundup_pow_of_two(1024)) };

struct ____btf_map_probe_do_sys_open_1_stacks {
    int key;
    struct bpf_stacktrace value;
};
struct ____btf_map_probe_do_sys_open_1_stacks
__attribute__ ((section(".maps.probe_do_sys_open_1_stacks"), used))
____btf_map_probe_do_sys_open_1_stacks = { }
When BFrontendAction scans __attribute__((section("maps/stacktrace"))), it creates a bpf map of type BPF_MAP_TYPE_STACK_TRACE; its key size is the key (int) of probe_do_sys_open_1_stacks_table_t, value size is its leaf (struct bpf_stacktrace).
struct bpf_stacktrace is:
struct bpf_stacktrace {
  u64 ip[BPF_MAX_STACK_DEPTH];
};
It’s just a u64 array; each u64 is a call-stack PC pointer — this data drives bcc’s stack unwinding.
When the eBPF program runs, it outputs bpf_get_stackid()’s long stack_id via bpf_perf_event_output(). Userspace uses the stack_id as the key in the bpf map and calls bpf(BPF_MAP_LOOKUP_ELEM) to get the struct bpf_stacktrace, then bcc symbolizes it its own way. The code is in table.py’s StackTrace class. Printing the stack:
for addr in stack:
                stackstr += '        '
                if Probe.print_address:
                    stackstr += ("%16x " % addr)
                symstr = bpf.sym(addr, tgid, show_module=True, show_offset=True)
                stackstr += ('%s\n' % (symstr.decode('utf-8')))
addr is the address list from bpf(BPF_MAP_LOOKUP_ELEM) via stack_id.
How is bpf_get_stackid() implemented? Direct answer: via fp-based stack unwinding. If interested, look at the kernel’s perf_callchain_user; I won’t detail it here.
This reveals why trace.py’s dump above was missing info: fp-based unwinding is fast, but if the binary was compiled with "-fomit-frame-pointer", no fp is generated and the stack info is missing. Using bcc on some major apps, most calls show unknown except the first line.
And func_a’s symbolization failure is because bcc symbolizes by reading /proc/pid/maps and parsing each .so’s ELF symbol table. Because of zipalign (https://developer.android.com/studio/command-line/zipalign), if all uncompressed files in the APK are aligned to the file start, the .so isn’t extracted to /data/app but mmap’d directly from the APK. bcc has poor APK support and can’t handle this. Also bcc reads /proc/pid/maps only once, and never re-reads it unless the whole executable is replaced — so later-loaded .so’s aren’t picked up.
Part 5. Solving the problem
Someone already raised this in bcc’s issue tracker: https://github.com/iovisor/bcc/issues/3515
It mentions the tool simpleperf. What trace.py can’t print, simpleperf can — because simpleperf unwinds via dwarf’s .eh_frame section, so even .so’s built with "-fomit-frame-pointer" unwind correctly. So combining simpleperf’s unwinding with bcc would solve it.
First, simpleperf usage. simpleperf is Android’s profiling tool, also built on perf_event_open. Suppose we trace process 4665’s sys_enter_clone — run on the phone, sampling 10 seconds:
$ simpleperf record -p 4665 --call-graph dwarf -e syscalls:sys_enter_clone --duration 10 -o /data/local/tmp/perf.dataThen copy /data/local/tmp/perf.data to aosp/system/extras/simpleperf/scripts and run report_sample.py to see all sys_enter_clone calls and their stacks.
simpleperf works as a fallback for reverse analysis, but its biggest flaw is that it can’t print syscall arguments, and can’t use hacky tricks to modify syscall arguments — while eBPF can execute custom code. So bcc combined with simpleperf’s unwinding would be the perfect pair.
From bcc’s maintainers’ replies, an official dwarf-based implementation won’t arrive soon. And Android’s runtime is special; bcc feels more Linux-PC-oriented. So we do it ourselves.
First understand simpleperf. For the command above, simpleperf builds this perf_event_attr:
struct perf_event_attr attr;
attr.size = sizeof(perf_event_attr);
attr.type = PERF_TYPE_TRACEPOINT;
attr.config = id; //cat /sys/kernel/debug/tracing/events/syscalls/sys_enter_openat/id
attr.disabled = 0;
attr.read_format = PERF_FORMAT_TOTAL_TIME_ENABLED | PERF_FORMAT_TOTAL_TIME_RUNNING | PERF_FORMAT_ID;
attr.sample_type |= PERF_SAMPLE_IP | PERF_SAMPLE_TID | PERF_SAMPLE_TIME | PERF_SAMPLE_PERIOD | PERF_SAMPLE_CPU | PERF_SAMPLE_ID | PERF_SAMPLE_RAW;
attr.sample_type |= PERF_SAMPLE_CALLCHAIN | PERF_SAMPLE_REGS_USER | PERF_SAMPLE_STACK_USER;
attr.sample_type &= ~PERF_SAMPLE_BRANCH_STACK;
attr.exclude_callchain_user = 1;
attr.sample_regs_user = ((1ULL << PERF_REG_ARM64_MAX) - 1);
attr.sample_stack_user = 65528;
attr.inherit = 0;
attr.sample_id_all = 1;     //SampleIdAll
attr.freq = 0;
attr.sample_period = DEFAULT_SAMPLE_PERIOD_FOR_TRACEPOINT_EVENT; //1
attr.mmap = 1;
attr.comm = 1;
sample_type specifies many types; the most important are PERF_SAMPLE_REGS_USER | PERF_SAMPLE_STACK_USER.
The perf commits that added dwarf stack-unwinding support: https://lwn.net/Articles/507753/ https://lore.kernel.org/all/1343391834-10851-7-git-send-email-jolsa@redhat.com/
PERF_SAMPLE_REGS_USERtells the kernel to deliver the userspace register info at event time (here, the syscall) in aPERF_RECORD_SAMPLErecord.PERF_SAMPLE_STACK_USERtells the kernel to deliver the userspace stack fragment at event time in aPERF_RECORD_SAMPLErecord.
With those two plus the target process’s maps info, simpleperf can call libunwindstack to unwind via dwarf:
  UnwindMaps& cached_map = cached_maps_[thread.pid];
  cached_map.UpdateMaps(*thread.maps);
  std::shared_ptr<unwindstack::MemoryOfflineBuffer> stack_memory(
      new unwindstack::MemoryOfflineBuffer(reinterpret_cast<const uint8_t*>(stack),
                                           stack_addr, stack_addr + stack_size));
  std::unique_ptr<unwindstack::Regs> unwind_regs(GetBacktraceRegs(regs));
  if (!unwind_regs) {
    return false;
  }
  unwindstack::Unwinder unwinder(MAX_UNWINDING_FRAMES, &cached_map, unwind_regs.get(),
                                 stack_memory);
  unwinder.SetResolveNames(false);
  unwinder.Unwind();
libunwindstack is Google’s stack-unwinding library, with powerful features: supports ARM32, ARM64, X86, X86_64, MIPS, MIPS_64; can associate ART VM OAT and JIT-debug native stacks.
In short: simpleperf gets the target’s register info, stack fragment, and maps, then calls libunwindstack for dwarf unwinding.
libunwindstack ships gtest-based tests under system/core/libunwindstack/tests; reading them helps understand its API. Run them with:
$ atest -bt libunwindstack_testSo if a bcc program can get the register info and stack fragment, it can call libunwindstack for dwarf unwinding too. Problems to solve:
- How to integrate with the existing bcc framework.
- Is there an existing bpf helper for this?
- bcc runs in Debian; how does it access Android’s
libunwindstack?
The bcc maintainers suggested maybe using bpf_probe_read_user to fetch userspace stack data, but eBPF’s execution stack is only 512 bytes, so the fetched data must be saved in a stack variable (pre-4.16 kernels), and many call stacks far exceed 512 bytes — I don’t think that’s good.
My solution: observing bpf_perf_event_output’s implementation, in the perf_output_sample it calls, if sample_type’s PERF_SAMPLE_REGS_USER bit is set, register data is sent; if PERF_SAMPLE_STACK_USER is set, userspace stack data is sent. So just set those flags when calling perf_event_open in the bcc program. Since bcc doesn’t handle these two data types, the read logic must be modified too.
After getting the data, start a process on the Android side that receives bcc’s data, calls libunwindstack to unwind, and returns the result to bcc — over a Unix domain socket.
To control when to print stacks, use a perf variable name ending in _with_stack:
BPF_PERF_OUTPUT(events_with_stack);In bpf_open_perf_buffer_opts in libbpf.c, if stacks are requested, adjust the perf args:
if (opts->unwind_call_stack == 1) {
    attr.sample_type |= PERF_SAMPLE_STACK_USER | PERF_SAMPLE_REGS_USER;
    attr.sample_stack_user = 16384;  // MAX=65528
    attr.sample_regs_user = ((1ULL << 33) - 1);
    attr.size = sizeof(struct perf_event_attr);
    reader->is_unwind_call_stack = true;
  }
Then in perf_reader.c’s parse_sw, parse the received register and stack data:
 if (reader->is_unwind_call_stack) {
    int pid = *(int *)raw->data;
    int write_size = ((uint8_t *)data + size) - ptr;
    print_frame_info(pid, ptr, write_size);
  }
A perf PERF_RECORD_SAMPLE record is a variable structure; here it’s:
 struct {
    struct perf_event_header header;
    u32    size;        /* if PERF_SAMPLE_RAW */
    char   data[size];  /* if PERF_SAMPLE_RAW */
    u64    abi;         /* if PERF_SAMPLE_REGS_USER */
    u64    regs[weight(mask)];
                        /* if PERF_SAMPLE_REGS_USER */
    u64    size;        /* if PERF_SAMPLE_STACK_USER */
    char   data[size];  /* if PERF_SAMPLE_STACK_USER */
    u64    dyn_size;    /* if PERF_SAMPLE_STACK_USER &&
                           size != 0 */
};
I wanted to request PERF_SAMPLE_TID to get the target’s /proc/pid/maps, but the data was always wrong — looking at the kernel code, it seems perf_prepare_sample doesn’t handle PERF_SAMPLE_TID. But the pid is available directly from the eBPF program: bpf_get_current_pid_tgid() >> 32;.
All fetched info is sent over a Unix domain socket to the remote Android daemon, which parses it:
static void print_frame_info(int pid, uint8_t *ptr, int write_size) {
  int fd = socket(PF_UNIX, SOCK_STREAM | SOCK_CLOEXEC, 0);
  if (fd == -1) {
    fprintf(stderr, "cannot socket()!\n");
  }
  const char *socket_path = "/dev/socket/mysock";
  struct sockaddr_un addr = {.sun_family = AF_UNIX};
  strncpy(addr.sun_path, socket_path, sizeof(addr.sun_path));

  int ret = connect(fd, (struct sockaddr *)(&addr), sizeof(addr));
  if (ret != 0) {
    fprintf(stderr, "connect() to %s failed: %s\n", socket_path,
            strerror(errno));
  } else {
    WriteFully(fd, &pid, 4);
    write_size += 4;
    WriteFully(fd, &write_size, 4);

    if (!WriteFully(fd, ptr, write_size)) {
      // fprintf(stderr, "All data were send.\n");
      fprintf(stderr, "prepare to write %d to socket\n", write_size);
      close(fd);
      return;
    }
    int frameinfo_size;
    if (ReadFully(fd, &frameinfo_size, 4)) {
      unsigned char frame_info[frameinfo_size + 1];
      if (ReadFully(fd, frame_info, frameinfo_size)) {
        frame_info[frameinfo_size] = '\0';
        printf("===================================>Frame:\n");
        printf("%s\n", frame_info);
      } else {
        fprintf(stderr, "Read frame_info from socket error.\n");
      }
    } else {
      fprintf(stderr, "Read frameinfo_size from socket error. \n");
    }

    close(fd);
  }
}
The Android daemon assembles the data and calls libunwindstack to print:
bool OfflineUnwinder::UnwindCallChain(DataBuff &buff, std::string &frame_info) {
    RegSet regs(buff.mRegs.abi, buff.mRegs.reg_mask, buff.mRegs.regs);
    uint64_t sp_reg_value;
    if (!regs.GetSpRegValue(&sp_reg_value)) {
        std::cerr << "can't get sp reg value" << std::endl;
        return false;
    } else {
#ifdef DEBUG
        std::cout << "sp_reg_value: 0x" << std::hex << sp_reg_value << std::endl;
#endif
    }
    uint64_t stack_addr = sp_reg_value;
    const char *stack = buff.mStack.data;
    size_t stack_size = buff.mStack.dyn_size;

    std::shared_ptr<unwindstack::MemoryOfflineBuffer> stack_memory(
            new unwindstack::MemoryOfflineBuffer(reinterpret_cast<const uint8_t *>(stack),
                                                 stack_addr, stack_addr + stack_size));
    std::unique_ptr<unwindstack::Regs> unwind_regs(GetBacktraceRegs(regs));
    if (!unwind_regs) {
        return false;
    }
    std::unique_ptr<unwindstack::Maps> maps;
    std::string data;
    std::string proc_map_file = "/proc/" + std::to_string(buff.mTargetPid) + "/maps";
    android::base::ReadFileToString(proc_map_file, &data);
    maps.reset(new unwindstack::BufferMaps(data.c_str()));
    maps->Parse();
    unwindstack::Unwinder unwinder(512, maps.get(), unwind_regs.get(), stack_memory);
    // unwinder.SetResolveNames(false);
    unwinder.Unwind();
    frame_info = DumpFrames(unwinder);
    return true;
}
Then the Android daemon sends the printed stack info back to bcc over the socket.
Done — let’s test. First the test program’s stack (built with -fomit-frame-pointer):

Figure 2 — Unwound stack for the test program
Perfect.
Now modify bcc’s tcpconnect.py to analyze a major app: change ipv4_events to ipv4_events_with_stack and ipv6_events to ipv6_events_with_stack to request stack printing:
python3 tcpconnect.py -u 10112The printed stack:
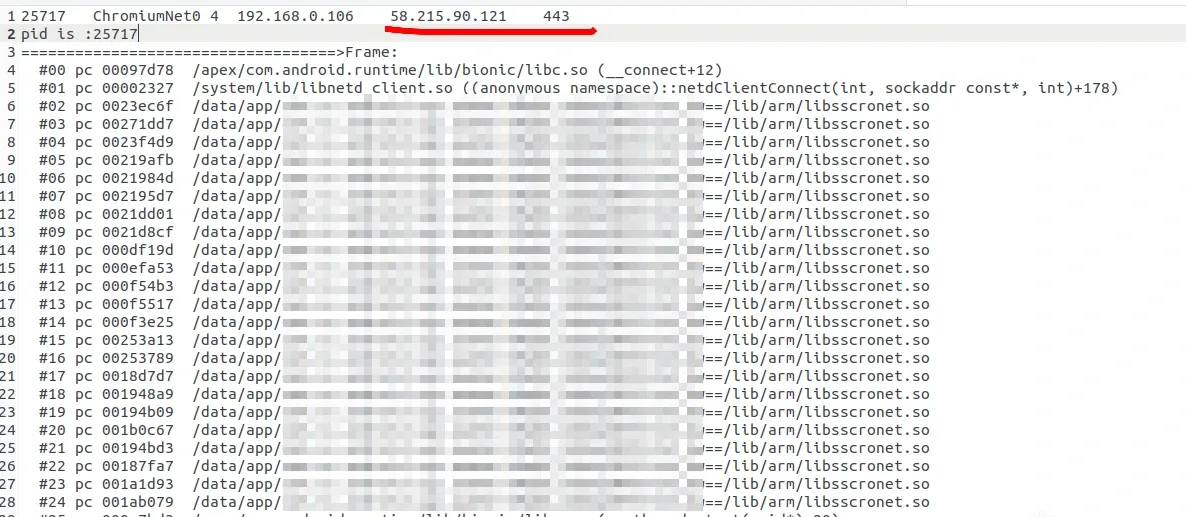
Figure 3 — Unwound stack for a real app
Not only are the stack offsets shown, but also the connected IP addresses and ports.
Can the .eh_frame section be stripped from the .so? It’s loaded at runtime; C++ exceptions rely on it. Stripping it crashes the program the moment any C++ exception code runs, and the app’s crash collection relies on it too — so dwarf unwinding via .eh_frame is currently a fairly reliable approach.
Colin Xiao — I take on contract reverse-engineering work, and writeups like this are how I show what I can do. If you need help with anything in this space — including but not limited to the areas I cover above — I’m available. No project is too big or too small — if it’s reverse engineering and I can do it, I’ll take it. DM me on X (@colinxiao_lab) or Telegram (@ColinXiao666).
Get in touch