A General Approach to Defeating VMProtect-Style Code Virtualization - JIT Tracing, Equivalence Rewriting, and Handler Matching
About the author. I’m Colin Xiao — an independent reverse engineer, mostly working solo on contract jobs. I dig into compiled code of every kind, including but not limited to: Android and iOS apps, x86/x64/ARM native binaries, packers and obfuscators, DRM and license checks, network protocols and APIs, crypto and signature algorithms, malware, game binaries, and embedded/IoT firmware. I also handle large-scale data collection and vulnerability research. If you have any project in mind, I’d be glad to take it on — whatever it is, as long as it’s within my wheelhouse. Just reach out. You can reach me on X at @colinxiao_lab or on Telegram at https://t.me/ColinXiao666.
This research is published for educational and defensive purposes. The target sample is anonymized throughout.
A couple of recent posts on VMProtect reminded me that years ago I spent a long stretch studying it and wrote a fair amount of code around it. So I went back through that old repository, and this post came out of it.
This isn’t a deep-dive technical walkthrough, but it’s not clickbait either. The “general solution” in the title means a general approach that works not just against VMProtect but against a whole family of code-protection schemes — Themida included. The quotes are because “general” only refers to the overall problem-solving strategy being the same across them.
The protection model
To find a general solution, we first have to state how this class of protector works. Simplified:
VMProtect is a stack-based virtual machine (Themida’s is heap-based). It finds space on the current thread’s stack to store the execution Context — most importantly, the register values the protected code needs. So at the moment the real code runs, VMProtect’s context is interleaved with the VM’s own stack data. Because VMProtect tracks stack movement during protection, the context layout is also randomized and adjusted dynamically, which raises the analysis bar further.
VMProtect’s protection converts original assembly into a custom opcode set, and each opcode has one or more execution fragments — the “handlers” (the code can differ, but the logic they perform must be identical). Handlers are designed per-opcode, so they evolve slowly — which is the big weakness of this kind of code VM.
Once the original code is turned into an opcode sequence, that sequence is its own kind of assembly, and it can be treated like ordinary assembly: either wrapped again in another opcode layer, or given equivalent substitutions and “flower” (garbage-insertion) obfuscation — the idea is always a trade-off between code size and execution speed. After the opcodes are encoded, there’s a matching opcode dispatcher, and its handling code is then obfuscated and combined with the framework code to produce the final program.
A general approach
Given that model, here’s the general solution I use for understanding the code and intervening in its execution flow. Full code recovery is only outlined, since that’s rarely the actual goal. (I’m skipping anti-debug bypass entirely — that’s separate from code protection, and while there are general solutions for it in ring 3 too, publishing them gets them patched quickly.)
The steps for flow intervention:
- Capture a code execution trace
- Simplify the code
- Taint/color the context offsets
- Match handler signatures, recover the opcode pseudo-execution trace
- Simplify the opcodes
- Debug the opcode pseudo-code to determine intervention intent
- Take over execution to intervene
- Recompile opcodes back to assembly (code recovery)
1. Capturing the execution trace
This first step trips up a lot of people because public tooling is thin, and x64dbg’s built-in tracer is far too slow when VMProtect’s handlers keep growing. My preference is a JIT-translating code VM — the method I use myself: take over execution at the VM entry, then run the code inside a heap-based code VM whose “opcode” is the original code and whose “handler” is the translated code itself. Register storage is the real register file plus a small heap area for the one or two registers the VM borrows.
This approach has a lot going for it: it’s simple to implement (no need to write handlers or define opcodes), it’s fast enough, it supports self-modifying code, and because it’s JIT it supports dynamic conditional intervention (e.g., detecting a loop and skipping repeated trace records).
Once you have the trace, you have a complete record from VM entry to exit:
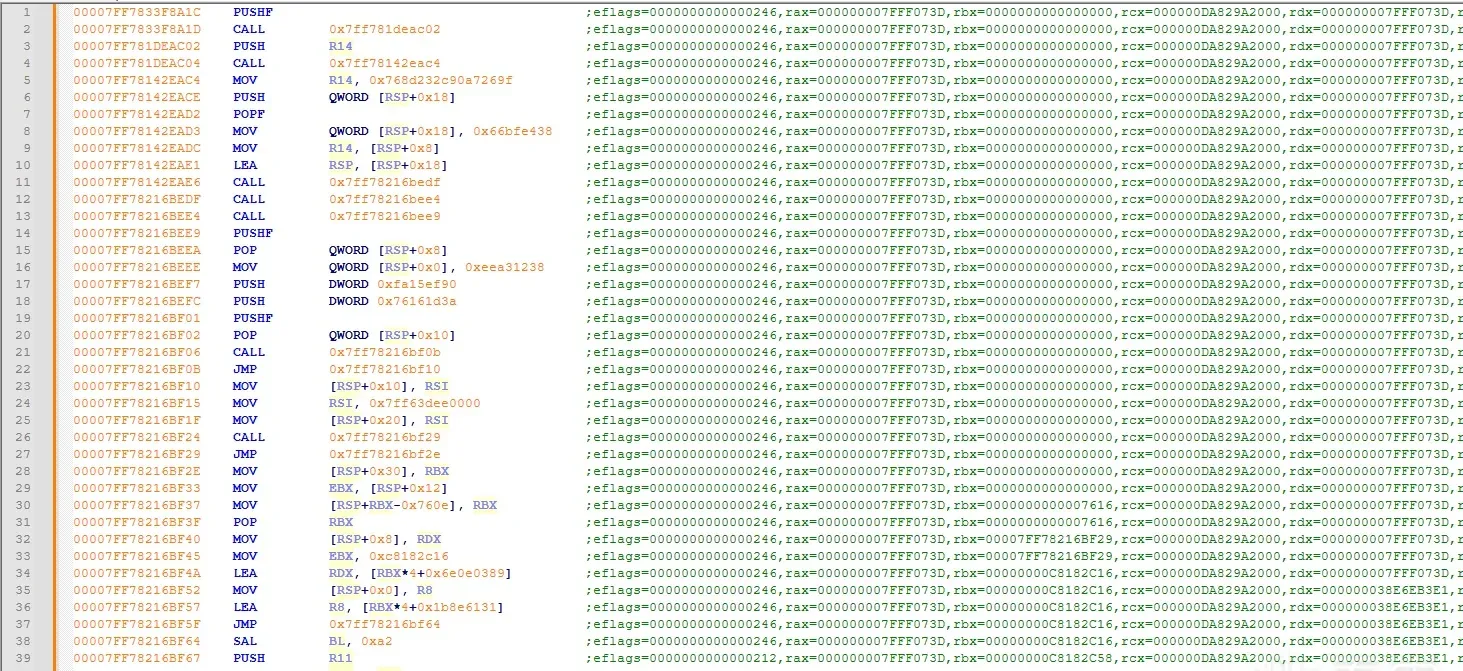
The trace includes the general-purpose registers, EFLAGS, code addresses, and the raw bytes of each executed instruction. Often a complete trace alone is enough to crack a program: snapshot the VM, run an authorized and an unauthorized execution, diff the two traces, and the comparison instantly shows you the exact decision point. Flip control flow there and you’re done — without reading a single line of assembly.
2. Simplifying the code
A raw trace can be enormous — massive repeated code, heavily obfuscated, morphed, and substituted. Analyzing it directly is a non-starter. Since the trace is top-to-bottom and carries register values, there’s a general way to simplify it. The core optimization is equivalence substitution — no fancy technique, but the implementations vary. Mine is a lightweight assembly match-and-replace language I wrote, which looks roughly like this:
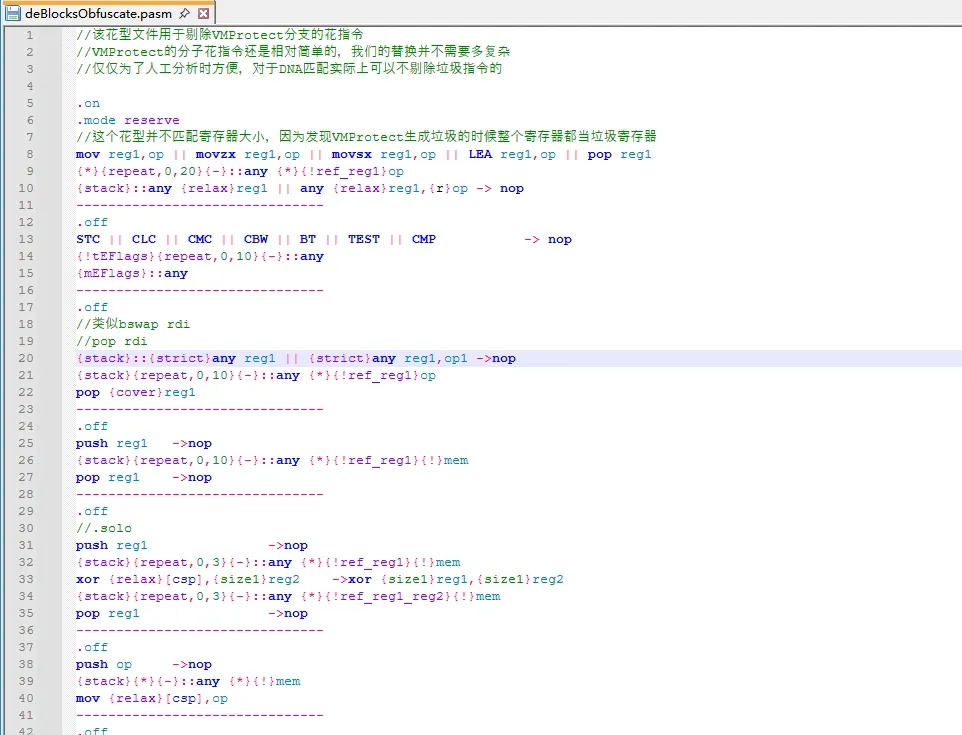
Here are the usage notes I wrote back then, which should give you the idea:
/* Pattern syntax:
----- : pattern separator, at least 5 dashes. After the separator you can define multiple pattern options:
.mode   isReverseMode   // pattern matching mode: reverse or forward, used to filter patterns
.x86                     // CPU instruction set type
.x86-64                  // pattern target CPU instruction set type; if unset, matches all
.max <integer>           // max instruction count a pattern can match
.uuid <integer>          // unique pattern id
.off                     // disable pattern (enabled by default)
.on                      // enable pattern
.comment <string>        // auto-comment for ollydbg debugging
.pattern <string>        // passed to the analysis program during DNA matching; patternASM is only passed through, never processed
.solo                    // used when debugging a pattern: only this pattern is enabled within the instance
// the pattern must contain the given hex data, mainly to speed up searching in large ranges:
.hexsig{1000,200} 55 13 ?? 1C
// means first search for the 55 13 ? 1C signature, then search for the pattern within 1000 bytes before and 200 bytes after each match
? means one arbitrary byte, then pattern matching follows:
= means an expression, simple computation such as imm1=imm2+imm1
:: means instruction match attributes, e.g. ::{*}{+}{?}
*: this line can be matched any number of times
?: matches 0 or 1 times
+: matches at least once
-: match as few as possible
{repeat,1,2}: repeat count range, like a regex
stack: the instruction must not affect stack balance
eflags: the instruction must not affect eflags
user1-user4: four user-marked flags; if a {user1-4} attribute is specified, the instruction must have been given the matching TIF_OPT_USERFLAG1 parameter in the testInst call
{mCF,mPF,mAF,mZF,mZF,mSF,mIF,mDF,mOF}: this set of flags is modified
{tCF,tPF,tAF,tZF,tZF,tSF,tIF,tDF,tOF}: this set of flags is tested
{mEflags,tEflags}: eflags modified or tested
{$1,$2}info prefix means record detailed match info for this line — very useful in DNA matching; after a successful match you can read the info to analyze the specific match
the ! symbol means negation, e.g. {!mCF} means CF was not modified
these flags are instruction-based and have nothing to do with actual execution, while eflags/stack attributes are based on the instruction's execution result
note: one instruction line allows only one :: marker, even when || is used to connect; so {?}::mov || {+}::lea is illegal — the {+} attribute takes no effect and {?} applies to the whole line
registers have several pseudo-registers: cax,cbx,ccx,cdx,csp,cbp,csi,cdi, corresponding to eax/rax on different platforms, depending on the bit width patternASM is initialized with
instruction attributes: {size1}{mnem12}{strict}{!}{8}{16}{32}{64}{cs}{ds}{es}{fs}{gs}{ss} — {cs}-{ss} can force matching a specified segment; a replacement instruction can force-replace the instruction's segment, and if unspecified the replacement inherits the segment attribute of the original instruction
{0} means match by processor pointer size
any means any instruction
jcc means a jump instruction, matching distorm's FC_CND_BRANCH
such as any reg1,imm1
{size1}{mem1}{reg1} are all variable-definition operand attributes, e.g. push {size1}{16}reg1,imm1{size1} references the size variable
{!}not {*}all op, if you need to match use the relax attribute
ref and !ref also support a display mode:
{ref_01234abc}  the operand must reference one of rax,rbx,rcx,rdx,r10,r11,r12
{!ref_89}       the operand cannot reference r8,r9
{ref_123_reg1_reg2} means simultaneously reference reg1,reg2
all ref series cannot apply to imm, because it's meaningless
{ref_xxx}{!ref_xxx} applied to an instruction means match or don't match the instruction's implicit registers — a different meaning than when applied to an operand
express cannot apply relax,size attributes
such as call {relax}$+5 compiles successfully, but the relax attribute is ignored
any reg1,mem by default matches when the first argument is a reg type, but once ref or !ref is used the first argument will still test non-reg-type instructions, because a memory operand may still reference reg1
{8}{16}{32}{64}{cover} // means the matched register covers the initial register, e.g. {stack}::{strict}any reg1 -> nop
pop {cover}reg1 means the register at this point must contain reg1
{!cover}{belong} if cover, the judgment basis is being contained
{!belong}{relax} relax means relaxed comparison — currently not comparing operand size
operand types: op1: all operands, reg1: register, imm1: immediate, mem1: addressing
if the operand type is not followed by a number, just reg,imm,mem, it means op-type matching only, no specific details
such as any {*}{!}mem means all instructions without a memory-addressing operand
usage example: push eax directly matches push reg1, any push-register matches
push {!ref}esp
replacement patterns can use {original} to mean directly replace with the original instruction, e.g. push reg1 -> {original} && nop
replacement instruction supported attributes: {original} {!ref}
replacement instruction supported operand types: rnr1_0123456789abcdef_nr0-f, the suffix is the register selection range, nr means randomly selected registers must also exclude registers used by the original instruction
{rnr1} means randomly pick a register; on first definition you can use rnr1_0123-f to define the random selection range, with eax,ebx,ecx,edx,ebp,esp,esi,edi,r8-r15 representing registers 0-15 respectively; on second use you reference it directly via rnr1
note: in replacement instructions, && connects multiple instructions, not ||
// with .hexsig you can speed up pattern search
// e.g. when we know a pattern contains at least 1 byte of concrete data
// then a large-range memory search can first search the hex signature, then
// narrow the range, which speeds up search exponentially
.hexsig{1000,200} 55 8B ? CC
mov reg,imm32 -> push imm32 && pop reg
{stack}::{mnem1}any op1,reg1 -> {mnem1}any op1,imm1
mnem1!=xchg|cmpxchg
imm3=imm2-imm1
imm4=imm3+2
$n object currently supported attributes: $n.ip means the IP of the matched instruction; if the match set is empty, it fails
such as {$1}::call $+5
jmp $1.ip
then jmp $1.ip will match jmp <call instruction>
*/
With a general semantics like this, you keep accumulating equivalence-substitution patterns and applying them to the trace. No matter how much obfuscation VMProtect piles on, once you’ve built up enough equivalent patterns you can dramatically simplify the code. And notice: the goal here isn’t to make the code readable — it’s only to simplify it enough to recognize the handler. We don’t actually care how the code cleverly executes; we just need to know which handler a block corresponds to. Something like this is close enough:
00007FF7825429E4 JMP       R9
00007FF7826B37CD MOVZX     EDI, BYTE [RBP-0x1]
00007FF7826B37D2 MOV       R8D, 0x1703c7ae
00007FF7826B37D8 LEA       RSI, [R8*4+0x652b39ae]
00007FF7826B37E0 XOR       DIL, R11B
00007FF7826B37E3 LEA       RAX, [RSI+RSI*4-0x12666cea]
00007FF7826B37EB XCHG      RSI, RAX
00007FF7826B37ED ADD       AX, 0x602
00007FF7826B37F1 ROR       DIL, 0x1
00007FF7826B37F4 DEC       DIL
00007FF7826B37F7 ADD       RSI, 0xcbb2bb0e
00007FF7826B37FE LEA       R8, [R8*4-0x13d9137e]
00007FF7826B3806 XOR       DIL, 0x10
00007FF7826B380A BTS       AX, AX
00007FF7826B380E MOV       ECX, ESI
00007FF7826B3810 SBB       DIL, 0x90
00007FF7826B3814 NOT       R8B
00007FF7826B3817 BTS       R8W, 0x18
00007FF7826B381D MOVZX     R10D, AL
00007FF7826B3821 XOR       R11B, DIL
00007FF7826B3824 ROR       AL, CL
00007FF7826B3826 OR        CX, CX
00007FF7826B3829 BSWAP     R8
00007FF7826B382C ADC       RDI, RSP
00007FF7826B382F DEC       ECX
00007FF7826B3831 DEC       SI
00007FF7826B3834 SHL       RCX, CL
00007FF7826B3837 MOV       RDX, [RDI+R10-0x68]
00007FF7826B383C ROR       RSI, 0xa0
00007FF7826B3840 BTS       SI, CX
00007FF7826B3844 MOVSX     EDI, AX
00007FF7826B3847 MOV       [R10+RBX-0x70], RDX
00007FF7826B384C XCHG      R10, R8
00007FF7826B384F MOV       ESI, [R8+RBP-0x6d]
00007FF7826B3854 XOR       ESI, R11D
00007FF7826B3857 CQO
00007FF7826B3859 XADD      R10W, DI
00007FF7826B385E JS        0x7ff78214929b
That block only went through a handful of pattern simplifications and it’s already good enough. We don’t care how the handler decodes offsets or decodes opcodes — we care about MOV RDX, [RDI+R10-0x68]. Since VMProtect is a stack machine, the registers in its context are never far from the stack pointer, and since our trace carries register values, we can decode RDI+R10-0x68 directly. The resulting offset points at some register in the stack context. Same for MOV [R10+RBX-0x70], RDX.
With rdi=000000DA82AFF090, r8=C50B364800000000, r9=00007FF7826B37CD, r10=0000000000000068, it’s easy to mark RDI as the stack-top address and R10 as a dynamically-decoded offset that, added to -0x68, gives 0. So we record the opcode execution as mov vdi,[vsp]. Repeat this and you recover the full opcode execution trace, saving each opcode’s address and register values.
Finding the opcode address is also easy: locate the rough range of opcode data, watch memory accesses, and find the instruction that touches opcode data — like MOV ESI, [R8+RBP-0x6d]. Compute R8+RBP-0x6d and that’s the opcode’s address.
3. Coloring the context offsets
Because it’s a code VM, the entry must save the register state. In practice VMProtect’s entry code, whatever it looks like, simplifies to push operations — saving the state is always first, otherwise it would clobber it. We can exploit this by simulating those entry instructions with unicorn or bochs and coloring the registers with special values:
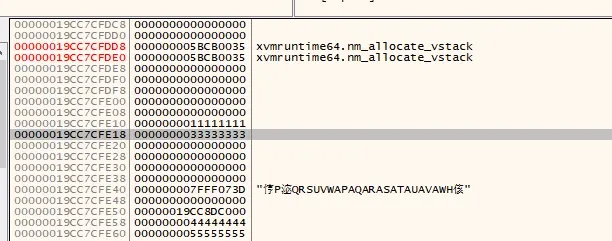
That gives us the initial register layout. From there, tracking each register’s offset as execution proceeds requires following the code’s actual behavior (mostly VMProtect’s own adjustments and the relative offset changes caused by vsp movement). It’s some coding work, but the logic isn’t complicated.
4. Matching handler signatures
After step 2 we have a simplified execution trace. If the pattern substitutions are written equivalently, the simplified code is execution-equivalent to the original, so we can start signature matching — again using the pattern-matching script, for example:
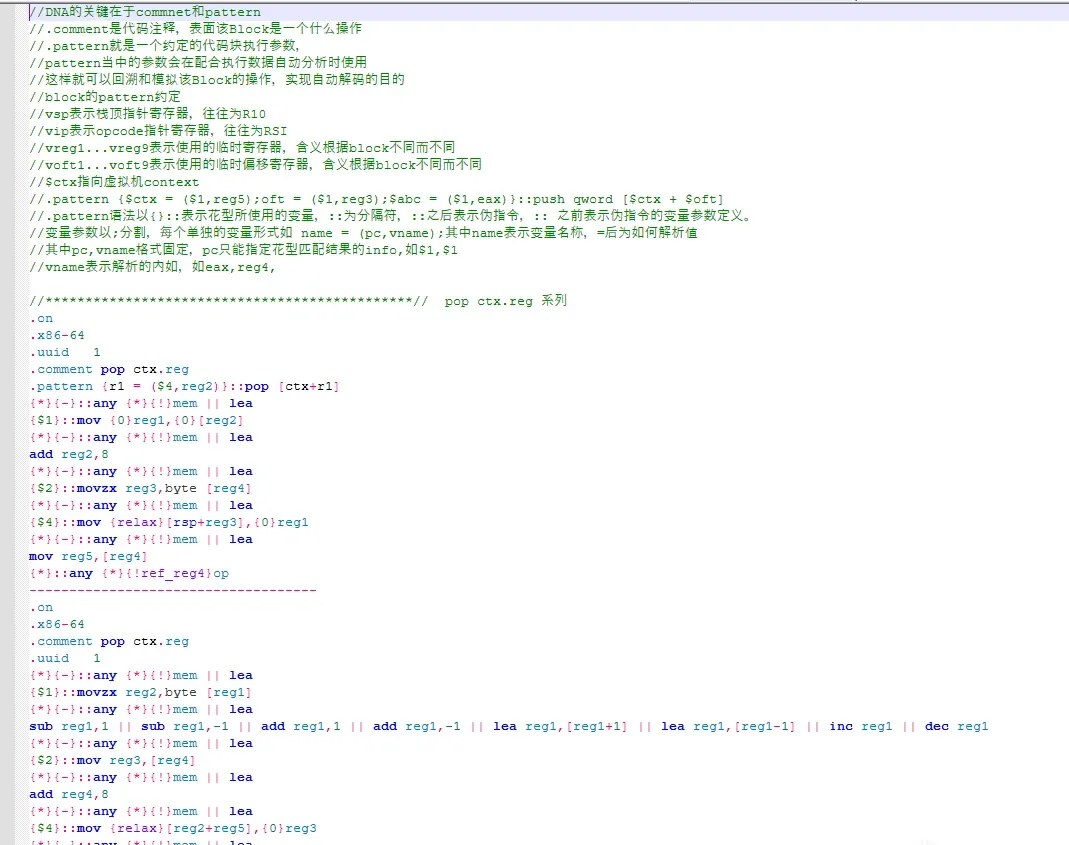
This is part of a handler-matching script for an old VMProtect version, but the approach is general and the flow is the same for newer versions — as said earlier, handlers are carefully designed so they don’t change often. Match handlers against the simplified code, combine with the register offsets we’ve been tracking, and we recover the full opcode execution trace — something like the map file of minified JS.
The opcode execution trace isn’t much different from the raw trace, except that now we express it in VMProtect’s own pseudo-opcodes. Analyzing those pseudo-opcodes is the most time-consuming part of the whole approach. The good news: there aren’t many opcodes, the VMProtect source has leaked, the opcodes are in plaintext inside VMProtect, and they’re largely consistent across versions and programs — so it’s a one-time cost.
5. Simplifying the opcodes
In theory you can simplify the opcode trace the same way as the code trace — pattern substitution on the pseudo-code. In practice, at least on older versions, the obfuscation here is light: only a few logic-gate instructions and jumps get special treatment, because bloating opcodes hurts final execution performance a lot and there’s a balance to keep. The confusion here also isn’t very valuable for us — it’s just one more pattern-replacement mechanism. Since I never had the actual need, I didn’t implement this specific substitution.
6. Debugging the pseudo-code to decide intent
At this point we can clearly analyze the original logic. But dynamic analysis beats static, so we can go further and write a debugger plugin that implements “set a breakpoint from the map” like a frontend dev would. This again reuses the JIT-translating code VM from step 1: because it controls the whole flow, it can monitor all code-memory accesses. Watch accesses to opcode data and you can break at opcode addresses, determine opcode start/end/length, and read fixed constants from the trace’s register values — giving you opcode-level stepping, breakpoints, and the rest. There’s real code volume here. I wrote a very usable ollydbg plugin, but ollydbg doesn’t support 64-bit, and x64dbg’s plugin interface is so awkward I only made a UI-less rough version, so I won’t show it.
7. Taking over execution to intervene
This is the actual goal — where the real work happens. Depending on the objective you decide where to interfere: which opcode address, what register values, how many times the opcode has executed, and so on. With the target pinned down, you move to implementation.
Again I recommend the JIT-translating code VM. Take over execution at the VM entry via a memory-access exception, hook, or other means, and run the code inside the JIT VM. Depending on your efficiency needs, you can compile patch code or patch function calls only at the critical points and merely translate everything else (e.g., skip function calls and only monitor execution inside the module). Then, on the trigger condition, act at the target address to change the code’s flow or data. This gives non-invasive patching, so you don’t have to worry about VMProtect’s integrity checks.
8. Recompiling opcodes to assembly (code recovery)
Usually once you’ve patched, you’ve achieved the goal. Based on current software reverse engineering, I can’t think of a real need to fully recover VMProtect code. But for completeness: since we already have the opcode execution trace, we could write a compiler that recompiles the opcodes back into x86/ARM — the same thing LLVM does from IR to machine code, or what TCG does.
Closing note
I haven’t written a post in a long time, so this is rough. I’d planned to clean the match-and-replace code into an open-source library, but a lot of it is tangled together (a pile of legacy spaghetti), so that’s on hold until I find the energy to have an AI help me decouple it. A scriptable assembly match-and-replace engine like this is useful for a lot of tasks — the pattern substitution above can simplify code, or be run in reverse to obfuscate it; add some complexity-increasing patterns and code balloons fast, and it can even do cross-process obfuscation that VMProtect can’t, since the engine has context and can embed LUA scripts.
Colin Xiao — I take on contract reverse-engineering work, and writeups like this are how I show what I can do. If you need help with anything in this space — including but not limited to the areas I cover above — I’m available. No project is too big or too small — if it’s reverse engineering and I can do it, I’ll take it. DM me on X (@colinxiao_lab) or Telegram (@ColinXiao666).
Get in touch