Quickly Locating a VM-Protected Algorithm with Frida Stalker
About the author. I’m Colin Xiao — an independent reverse engineer, mostly working solo on contract jobs. I dig into compiled code of every kind, including but not limited to: Android and iOS apps, x86/x64/ARM native binaries, packers and obfuscators, DRM and license checks, network protocols and APIs, crypto and signature algorithms, malware, game binaries, and embedded/IoT firmware. I also handle large-scale data collection and vulnerability research. If you have any project in mind, I’d be glad to take it on — whatever it is, as long as it’s within my wheelhouse. Just reach out. You can reach me on X at @colinxiao_lab or on Telegram at https://t.me/ColinXiao666.
This research is published for educational and defensive purposes. The target sample is anonymized throughout.
Quickly Locating a VM-Protected Algorithm with Frida Stalker
While searching for material on sgmain, I came across a post whose trace tool caught my interest — as did its decompiler engine. Not having the depth to build my own decompiler, I relied on third-party ones and instead tried modifying Frida’s Stalker into a similar trace tool. This article is the result of testing that idea.
Tools: IDA, Ghidra, Frida. The target is sgmain from a major e-commerce app, version 6.5.82. Since this is only a validation of the trace tool, it doesn’t include actual algorithm analysis — just my impressions during testing. The quick location mostly relies on Stalker; IDA and Ghidra are mainly for static analysis.
On the static side, I won’t argue which decompiler engine is fundamentally better — just the hands-on feel. First, a comparison on sgmain’s doCommand method.
IDA’s output:
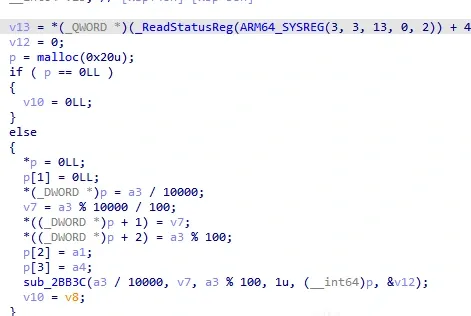
Figure 1 — doCommand in IDA
Ghidra’s output:
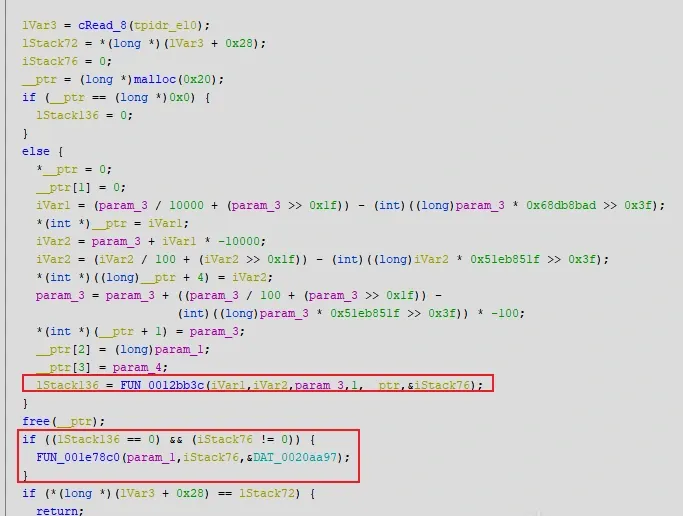
Figure 2 — doCommand in Ghidra
The source is roughly:
__int64 __fastcall sub_2DB50(JNIEnv *param_1,_int64 param_2,int param_3,long param_4){
    unsigned int v12 = 0;
    long ret = 0;
    long* ptr = (long*)malloc(0x20);
    if(ptr != nullptr){
        ptr[0] = 0LL;
        ptr[1] = 0LL;
        *(_DWORD *)ptr = param_3 / 10000;
        v7 = param_3 % 10000 / 100;
        *((_DWORD *)ptr + 1) = v7;
        *((_DWORD *)ptr + 2) = param_3 % 100;
        ptr[2] = param_1;
        ptr[3] = param_4;
        ret = sub_2BB3C(param_3 / 10000, v7, param_3 % 100, 1u, ptr, &v12);
    }
    free(ptr);

    if(ret == 0 && v12 != 0){
        //throw Exception
        sub_E78C0(param_1, v12, 0x20aa97)
    }
    return ret;
}
IDA clearly optimizes division better; Ghidra’s division handling is weaker. But I personally prefer Ghidra’s output.
A side note on division: compilers usually convert integer division into multiplying by a magic number and shifting right by a power of two. The derivation is complex — essentially turning “divide by any integer” into “divide by 2^N” — with many edge cases. But when IDA-style decompilers need manual derivation, there’s an online method to approximate the value; it involves sign and modulo issues (Sub-class instructions may indicate modulo), which I didn’t dig into. If interested, compile and compare yourself.
Generally, when you see these together — multiplication, shift by 0x3F/0x1F to get the sign bit, and ASR — it’s almost certainly a division:
LOAD:000000000002DBFC A9 75 91 52+                MOV             W9, #0x68DB8BAD
LOAD:000000000002DBFC 69 1B AD 72
LOAD:000000000002DC04 A9 7E 29 9B                 SMULL           X9, W21, W9
LOAD:000000000002DC08 1F 7D 00 A9                 STP             XZR, XZR, [X8]
LOAD:000000000002DC0C E8 1B 40 F9                 LDR             X8, [SP,#0x80+p]
LOAD:000000000002DC10 2C FD 7F D3                 LSR             X12, X9, #0x3F ; '?'
LOAD:000000000002DC14 29 FD 6C 93                 ASR             X9, X9, #0x2C ; ','
LOAD:000000000002DC18 20 01 0C 0B                 ADD             W0, W9, W12
LOAD:000000000002DC1C 0A E2 84 52                 MOV             W10, #0x2710
LOAD:000000000002DC20 EB A3 90 52                 MOV             W11, #0x851F
LOAD:000000000002DC24 00 01 00 B9                 STR             W0, [X8]
LOAD:000000000002DC28 6B 3D AA 72                 MOVK            W11, #0x51EB,LSL#16
LOAD:000000000002DC2C 0A D4 0A 1B                 MSUB            W10, W0, W10, W21
LOAD:000000000002DC30 E8 1B 40 F9                 LDR             X8, [SP,#0x80+p]
LOAD:000000000002DC34 4A 7D 2B 9B                 SMULL           X10, W10, W11
LOAD:000000000002DC38 A9 7E 2B 9B                 SMULL           X9, W21, W11
LOAD:000000000002DC3C 4B FD 7F D3                 LSR             X11, X10, #0x3F ; '?'
LOAD:000000000002DC40 4A FD 65 93                 ASR             X10, X10, #0x25 ; '%'
LOAD:000000000002DC44 41 01 0B 0B                 ADD             W1, W10, W11
LOAD:000000000002DC48 01 05 00 B9                 STR             W1, [X8,#4]
LOAD:000000000002DC4C 2A FD 7F D3                 LSR             X10, X9, #0x3F ; '?'
LOAD:000000000002DC50 28 FD 65 93                 ASR             X8, X9, #0x25 ; '%'
LOAD:000000000002DC54 E9 1B 40 F9                 LDR             X9, [SP,#0x80+p]
LOAD:000000000002DC58 08 01 0A 0B                 ADD             W8, W8, W10
LOAD:000000000002DC5C 8A 0C 80 52                 MOV             W10, #0x64 ; 'd'
LOAD:000000000002DC60 02 D5 0A 1B                 MSUB            W2, W8, W10, W21
LOAD:000000000002DC64 22 09 00 B9                 STR             W2, [X9,#8]
For code like the above, you can estimate the divisor with (1 << XX) / (magicNum - 1). For the instructions above:
>>> (1 << 0x2c) / (0x68db8bad - 1)
10000.000002510205
>>> (1 << 0x25) / (0x51eb85ef - 1)
99.99998491839733
Also, in terms of post-patch immediate feedback, I find Ghidra better — especially recognizing br reg, adrp, ret-style jumps. In IDA the JMPOUT is awkward: even with jump patching, F5 may not work, and you may need to remove some obfuscating junk in between.
Ghidra has its own awkward spot: in the code above, the function 0x2bb3c (Ghidra auto-adds a base, default 0x100000) was initially recognized as an empty function with no return, which directly hid the code block containing 0xe78c0, since lStack76 != 0 was treated as unreachable. After fixing the function definition, the code regenerated immediately — the update is instant and works well.
Now, most indirect-jump obfuscation, however it’s mutated, is often just constant expressions. Constant-expression indirect jumps have several handling approaches. Take this code at the head of 0x2bb3c:
LOAD:000000000002BB3C                 SUB             SP, SP, #0x1B0
LOAD:000000000002BB40                 STP             X28, X27, [SP,#0x1A0+var_50]
LOAD:000000000002BB44                 STP             X26, X25, [SP,#0x1A0+var_40]
LOAD:000000000002BB48                 STP             X24, X23, [SP,#0x1A0+var_30]
LOAD:000000000002BB4C                 STP             X22, X21, [SP,#0x1A0+var_20]
LOAD:000000000002BB50                 STP             X20, X19, [SP,#0x1A0+var_10]
LOAD:000000000002BB54                 STP             X29, X30, [SP,#0x1A0+var_s0]
LOAD:000000000002BB58                 ADD             X29, SP, #0x1A0
LOAD:000000000002BB5C                 MRS             X26, #3, c13, c0, #2
LOAD:000000000002BB60                 MOV             W23, W1
LOAD:000000000002BB64                 MOV             W24, W0
LOAD:000000000002BB68                 MOV             W10, #0x2710
LOAD:000000000002BB6C                 MOV             W12, #0x64 ; 'd'
LOAD:000000000002BB70                 LDR             X14, [X26,#0x28]
LOAD:000000000002BB74                 MUL             W15, W24, W10
LOAD:000000000002BB78                 MUL             W12, W23, W12
LOAD:000000000002BB7C                 MOV             W22, W2
LOAD:000000000002BB80                 MOV             W13, #0xC600
LOAD:000000000002BB84                 ADD             W10, W15, W12
LOAD:000000000002BB88                 MOV             W8, #0x96
LOAD:000000000002BB8C                 SUB             X9, X29, #-var_70
LOAD:000000000002BB90                 MOVK            W13, #0x53E,LSL#16
LOAD:000000000002BB94                 ADD             W10, W10, W22
LOAD:000000000002BB98                 MOV             X21, X4
LOAD:000000000002BB9C                 ADD             W13, W10, W13
LOAD:000000000002BBA0                 STUR            X14, [X29,#var_58]
LOAD:000000000002BBA4                 STUR            W8, [X29,#var_70]
LOAD:000000000002BBA8                 ADR             X27, loc_2BBAC
LOAD:000000000002BBAC
LOAD:000000000002BBAC loc_2BBAC                               ; DATA XREF: sub_2BB3C+6C↑o
LOAD:000000000002BBAC                 LDRSW           X4, =0xFFFFFE62
LOAD:000000000002BBB0                 MOV             X20, #0xAB
LOAD:000000000002BBB4                 EOR             X4, X4, X20
LOAD:000000000002BBB8                 ADD             X4, X4, #0x88
LOAD:000000000002BBBC                 MVN             X4, X4
LOAD:000000000002BBC0                 LDRSW           X10, [X9]
LOAD:000000000002BBC4                 EOR             X4, X4, X10
LOAD:000000000002BBC8                 ADD             X27, X27, X4
LOAD:000000000002BBCC                 MOV             X8, #0x62 ; 'b'
LOAD:000000000002BBD0                 BR               X27
The code looks complex — all sorts of arithmetic and indirect address access — and each function head has such an indirect jump, seemingly with a different expression. But handling it is actually simple, in two cases: static and dynamic.
The dynamic case is trivial: single-step or trace to get the jump target. Ghidra doesn’t even need special handling — it computes the constant expressions itself and substitutes the results during decompilation. Ghidra’s assembly view:
                             LAB_0013dd1c                                    XREF[1]:     0013dd00(j)
        0013dd1c e8 03 00 90     adrp       x8,0x1b9000
        0013dd20 08 01 11 91     add        x8,x8,#0x440
        0013dd24 08 09 40 f9     ldr        x8,[x8, #0x10]=>DAT_001b9450                     = 000000000013DC94h
        0013dd28 08 71 02 91     add        x8,x8,#0x9c
        0013dd2c 00 01 1f d6     br         x8=>LAB_0013dd30
If you must use IDA without dynamic debugging, it’s also easy — use an IDA script with Unicorn to emulate and get the result:
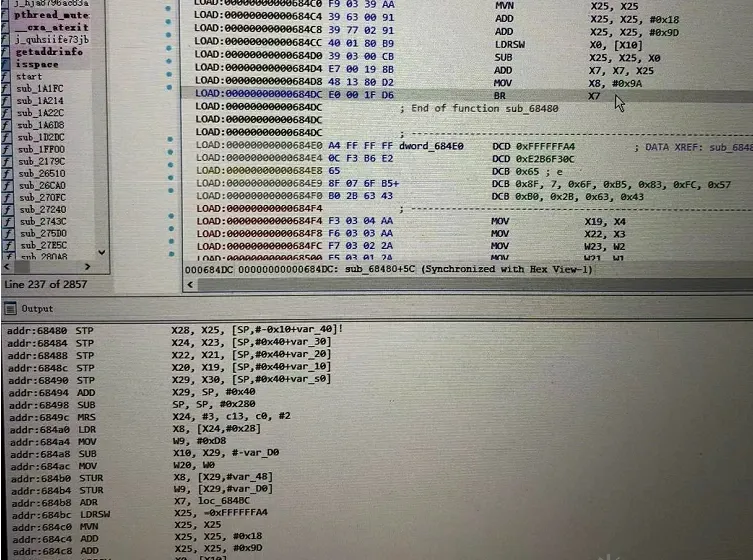
Figure 3 — Unicorn emulation in IDA
For indirect jumps surrounded by various jumps between code — e.g. an indirect jump in the middle of a function in IDA:
LOAD:000000000002BD58             loc_2BD58                               ; DATA XREF: sub_2BB3C+3B0↓o
LOAD:000000000002BD58                                                     ; LOAD:off_16FC38↓o
LOAD:000000000002BD58 E9 23 0A A9                 STP             X9, X8, [SP,#0x1A0+var_100]
LOAD:000000000002BD5C 88 36 40 F9                 LDR             X8, [X20,#(off_16FC28 - 0x16FBC0)] ; loc_2BD68
LOAD:000000000002BD60 FF 0F 00 F9                 STR             XZR, [SP,#0x1A0+var_188]
LOAD:000000000002BD64 08 2D 00 91                 ADD             X8, X8, #0xB
LOAD:000000000002BD68
LOAD:000000000002BD68             loc_2BD68                               ; DATA XREF: sub_2BB3C+220↑o
LOAD:000000000002BD68                                                     ; LOAD:off_16FC28↓o
LOAD:000000000002BD68 03 00 00 14                 B               loc_2BD74 ; loc_2BD74 ; Keypatch modified this from:
LOAD:000000000002BD68                                                     ;   BR X8
Ghidra’s mid-function indirect jump:
                             LAB_0013dd1c                                    XREF[1]:     0013dd00(j)
        0013dd1c e8 03 00 90     adrp       x8,0x1b9000
        0013dd20 08 01 11 91     add        x8,x8,#0x440
        0013dd24 08 09 40 f9     ldr        x8,[x8, #0x10]=>DAT_001b9450                     = 000000000013DC94h
        0013dd28 08 71 02 91     add        x8,x8,#0x9c
        0013dd2c 00 01 1f d6     br         x8=>LAB_0013dd30
The handling is basically the same: even if IDA or Ghidra can compute the target, they’ll hint at it — the IDA above hints the address is loc_2BD68 — but to keep the flow as accurate as possible they generally don’t constant-fold in the disassembly window, so you patch manually.
Forcing IDA with Unicorn is possible but not great for generality, since some constants live in other code blocks and address-constant accesses are mixed in. So in those cases, prefer trace data or existing tool decompilation results as a patching reference. For example, Ghidra hints at similar blocks in its decompiler:
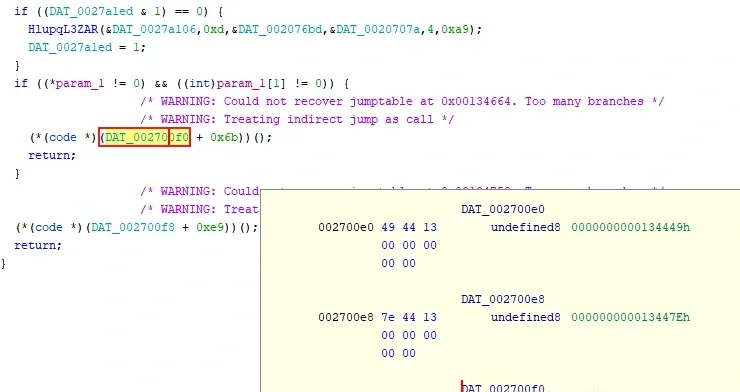
Figure 4 — Ghidra’s hint for a computed branch
In the assembly page:
                             LAB_00134638                                    XREF[1]:     00134604(j)
        00134638 69 22 40 a9     ldp        x9,x8,[x19]
        0013463c a8 03 18 f8     stur       x8,[x29, #local_90]
        00134640 08 7d 40 92     and        x8,x8,#0xffffffff
        00134644 a9 a7 38 a9     stp        x9,x9,[x29, #local_88]
        00134648 a8 c3 17 b8     stur       w8,[x29, #local_94]
        0013464c e9 07 00 b4     cbz        x9,LAB_00134748
        00134650 c8 07 00 34     cbz        w8,LAB_00134748
        00134654 f6 09 00 90     adrp       x22,0x270000
        00134658 d6 82 01 91     add        x22,x22,#0x60
        0013465c c8 4a 40 f9     ldr        x8,[x22, #0x90]=>DAT_002700f0                    = 00000000001345FDh
        00134660 08 ad 01 91     add        x8,x8,#0x6b
        00134664 00 01 1f d6     br         x8=>LAB_00134668
You can see Ghidra already computed the constant address via its own logic, but didn’t update the disassembly. After patching, the effect is immediate:
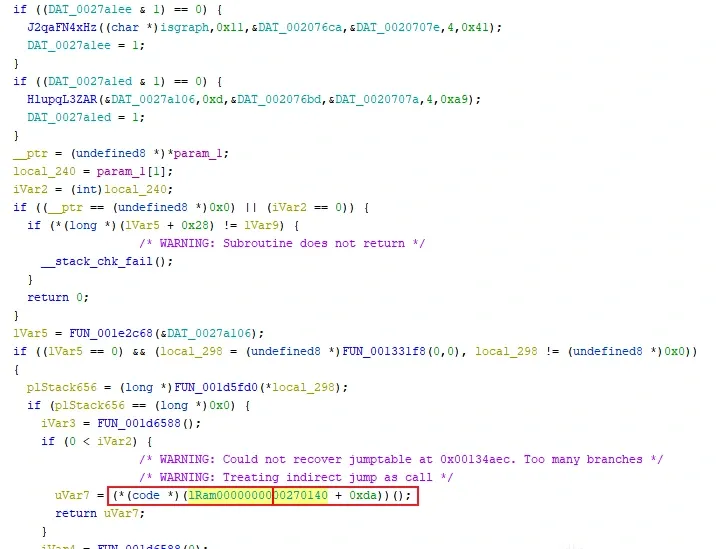
Figure 5 — After patching the computed branch
This is an indirect jump using a global variable (roughly: the content at global 0x270140 plus 0xda yields the call address). Ghidra recognizes multiple possible results here, so this case requires dynamic analysis — different flows may yield different results.
Most common obfuscation follows the same playbook; anything more complex than this ultimately comes down to tracing.
The interesting structures behind FUN_0012bb3c:
typedef struct _StData{
    void ** ppParamSt;
    int sz;
}StData;

typedef struct _StParam1{
    int param;
    int unknow;
    StData* pSD;
}StParam1;

typedef struct _StParam2{
    int unknow;
    int param;
    long flag;
    StData* pSD;
}StParam2;

typedef struct _StParam3{
    long unknow;
    int param;
    int unknow;
    long encryFuncAddr;
}StParam3;


long FUN_0012bb3c(int param_1, int param_2, int param_3, int param_4,
                  long *param_5, int *param_6)
{
    int iVar1;
    long lVar2;
    StParam3 *pSVar3;
    long local_1a8;
    StParam1 *pSStack416;
    long lStack408;
    StParam2 *pSStack400;
    long lStack392;
    int local_17c;
    long local_178;
    int local_7c;
    long *plStack120;
    int *piStack112;
    long local_68;
    StData **pplVar1;

    local_7c = 1;
    plStack120 = param_5;
    piStack112 = param_6;
    local_178 = FUN_00168480(param_1 * 10000 + param_2 * 100 + param_3 + 88000000,
                            param_4, 0, &plStack120, &local_7c);
    if (local_7c != 0) {
        pplVar1 = (long **)0x279af0;    //global variable, not constant
        if (param_4 != 0) {
            pplVar1 = (long **)&DAT_00279ae8;   //global variable, not constant
        }

        iVar1 = (*pplVar1)->sz;
        if(iVar1 < 1){
            local_17c = 0x26b0;
        }else{
            for(local_1a8 = 0; local_1a8 < iVar1; local_1a8++){
                pSStack416 = (StParam1*)(*pplVar1)->ppParamSt[local_1a8];
                if(pSStack416->param == param_1){
                    goto LAB_JMP1;
                }
            }
            pSStack416 = 0;
LAB_JMP1:
            if(pSStack416 == 0){
                local_17c = 0x26b0;
            }else{
                iVar1 = pSStack416->pSD->sz;
                if(iVar1 < 1){
                    local_17c = 0x26b1;
                }else{
                    for(lStack408 = 0; lStack408 < iVar1; lStack408++){
                        pSStack400 = (StParam2*)pSStack416->pSD->ppParamSt[lStack408];
                        if(pSStack400->param == param_2){
                            goto LAB_JMP2;
                        }
                    }
                    pSStack400 = 0;
LAB_JMP2:
                    if(pSStack400 == 0){
                        local_17c = 0x26b1;
                    }else{
                        iVar1 = pSStack400->pSD->sz;
                        if(iVar1 > 0){
                            for(lStack392 = 0; lStack392 < iVar1; lStack392++){
                                pSVar3 = (StParam3*)pSStack400->pSD->ppParamSt[lStack392];
                                if(pSVar3 != 0 && pSVar3->param == param_3){
                                    local_178 = (*(func*)(pSStack400->flag ^ pSVar3->encryFuncAddr))(param_5, param_6);
                                    return local_178;
                                }
                            }
                        }
                        local_17c = 0x26b2;
                    }
                }
            }

        }

        if (param_6 != (int *)0x0) {
            *param_6 = local_17c + (param_2 * 100 + param_1 * 10000 + param_3) * 10000;
        }
        local_178 = 0;
    }


    return local_178;
}
Stalker and IDA’s tracer each have their trade-offs. IDA’s tracer rides on the debugger, so it inherits every debugger weakness; it usually works best paired with a DBG_Hooks script. I tend to reach for it only after I’ve already narrowed the range, or to trace an exit path backward toward detection code. But since this article is about Stalker, I’ll leave IDA’s tracer aside.
Stalker has existed for a long time, but it only really saw heavy use after arm64; on arm32 you have to handle jump-address issues. In practice I found that enabling the call event almost guarantees a crash, so I ran with every event off — essentially using only the transform callback.
A few issues I hit along the way:
-
Stalker’s model seems to treat every control-flow instruction (
b/retand the like) as a block boundary.iterator.next()at thetransformentry returns the block’s starting address, so using a specific address directly to decide whether it’s in the traced range can mislead. For example, when I tried hooking an arbitrary instruction without iterating the whole block — just comparingaddr.compare == 0— it never hit, because eachtransformcall only hands you the block’s start address. -
For the same reason, the instructions in
iterator.putCalloutcontain nob/ret-style jumps. On arm32 I never saw the classicadrp pc, #immpattern here, so I’m not sure how that case would behave. -
instruction.regsReadandregsWrittenare empty; jumps and conditional instructions have values, but ordinary registers aren’t included. I suspect this is a deliberate performance choice. It’s not a big deal — you just have to be careful when printing register values for instructions likeldr x0,[x0].
Other than that there’s little to complain about. Overall speed is decent, though it occasionally dies on large code — especially when stepping into bl instructions.
I wrapped a few helpers on top of Stalker:
//trace function
//param0: module to trace
//param1: hook point that activates the trace; mainly for conditional checks — only trace when conditions match
//param2-param3: code block range to trace; controls the traced instruction range
//param4: whether to step in (don't follow outside the module), default false; true tends to trip a time check and crash
// trace_entry("libsgmainso-6.5.82.so", base.add(0x2db50), 0x2bb3c, 0x2befc)

//same as above, but traces all bl instructions and prints argument info; great for quick location
//the test here is a string; adjust as needed for other types
// trace_entry_bl("libsgmainso-6.5.82.so", base.add(0x2db50), 0x2db50, 0x2DCF0, true)

//traces all logic instructions (lsl/lsr etc.), printing offset/VA and detailed instruction info; in practice too noisy
// trace_entry_logic("libsgmainso-6.5.82.so", base.add(0x2db50), 0x2db50, 0x2DCF0, true)

//same as above
//param4: invoke the callback when the instruction at the given address executes
//param5: callback function
//mainly for printing data at special addresses during execution
// trace_callback("libsgmainso-6.5.82.so", 0x2db50, 0x2bb3c, 0x2befc, 0x2bc84, function(context) {
//     var insn = Instruction.parse(context.pc)
//     var insnStr = insn.toString().padEnd(25, " ")
//     var strLog = insn.address.sub(g_baseAddr) + "  " + insn.address + ":\t" + insnStr + "\t" + "  " + getOpInfo(context, insn)
//     console.log(strLog)
//
// })
Since this was just a quick test, I didn’t specifically hunt down which function computes the sign — I threw in a few values, masked out the ones I didn’t need, and got this:
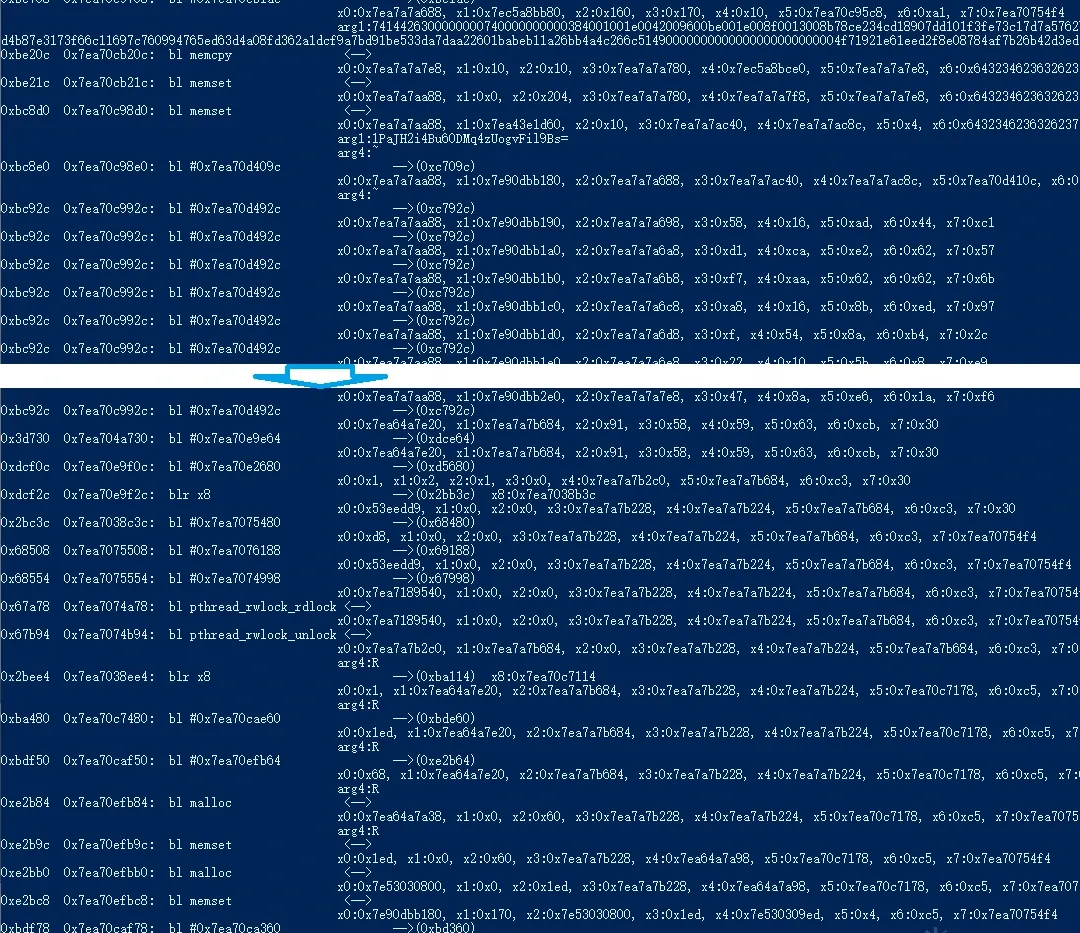
Figure 6 — trace of the sign computation
The intermediate calls in the sign computation are fairly clear. Roughly, at 0xbc708 it calls bl 0xbe1ac, then at 0xbc8e0 it calls 0xc709c with the argument string 1PaJH2i4Bu60DMq4zUogvFil9Bs=, followed by a chain of bl 0xc792c; then a new function call bl 0x2bb3c executes, and after that:
                                                x0:0x7ec5a203e0, x1:0x1ec, x2:0x1ec, x3:0x0, x4:0x0, x5:0x0, x6:0x0, x7:0x7ea70754f4
0xe73ac  0x7ea70f43ac:  blr x8                          -->(libart.so!0x32d3a4  _ZN3art3JNI12NewByteArrayEP7_JNIEnvi)  x8:0x7ecf7133a4
x0:0x7ec5a203e0, x1:0x49, x2:0x0, x3:0x1ec, x4:0x7e53030800, x5:0x7ea7a7b348, x6:0x0, x7:0x7ea70754f4
                                                arg4:enxH+QwhGIL9C/JrXXXXXXXXXXXXXXXXXXXXXXXXXXXXXXXXXXXXXXXXXXXXXXXXXXXXXXXXXXXXXXjm6o=
0xe7414  0x7ea70f4414:  blr x8                          -->(libart.so!0x32d424  _ZN3art3JNI18SetByteArrayRegionEP7_JNIEnvP11_jbyteArrayiiPKa)  x8:0x7ecf713424
The flow looks reasonably clean. Then I took a look in Ghidra — and it’s painful to look at. A few snippets to enjoy:
0xbc560
                do {
                  uVar11 = puVar6[1];
                  uVar10 = *puVar6;
                  local_880 = CONCAT17((byte)((ulong)local_870 >> 0x38) ^
                                       (byte)((uVar10 & 0xffffff0000000000) >> 0x38),
                                       CONCAT16((byte)((ulong)local_870 >> 0x30) ^
                                                (byte)((uVar10 & 0xffffff0000000000) >> 0x30),
                                                CONCAT15((byte)((ulong)local_870 >> 0x28) ^
                                                         (byte)(uVar10 >> 0x28),
                                                         CONCAT14((byte)((ulong)local_870 >> 0x20) ^
                                                                  (byte)(uVar10 >> 0x20),
                                                                  CONCAT13((byte)((ulong)local_870
                                                                                 >> 0x18) ^
                                                                           (byte)(uVar10 >> 0x18),
                                                                           CONCAT12((byte)((ulong)
                                                  local_870 >> 0x10) ^ (byte)(uVar10 >> 0x10),
                                                  CONCAT11((byte)((ulong)local_870 >> 8) ^
                                                           (byte)(uVar10 >> 8),
                                                           (byte)local_870 ^ (byte)uVar10)))))));
                  uStack2168 = CONCAT17((byte)((ulong)uStack2152 >> 0x38) ^
                                        (byte)((uVar11 & 0xffffff0000000000) >> 0x38),
                                        CONCAT16((byte)((ulong)uStack2152 >> 0x30) ^
                                                 (byte)((uVar11 & 0xffffff0000000000) >> 0x30),
                                                 CONCAT15((byte)((ulong)uStack2152 >> 0x28) ^
                                                          (byte)(uVar11 >> 0x28),
                                                          CONCAT14((byte)((ulong)uStack2152 >> 0x20)
                                                                   ^ (byte)(uVar11 >> 0x20),
                                                                   CONCAT13((byte)((ulong)uStack2152
                                                                                  >> 0x18) ^
                                                                            (byte)(uVar11 >> 0x18),
                                                                            CONCAT12((byte)((ulong)
                                                  uStack2152 >> 0x10) ^ (byte)(uVar11 >> 0x10),
                                                  CONCAT11((byte)((ulong)uStack2152 >> 8) ^
                                                           (byte)(uVar11 >> 8),
                                                           (byte)uStack2152 ^ (byte)uVar11)))))));
                  FUN_001c792c(auStack592,puVar9,&local_880);
                  uStack2152 = puVar9[1];
                  local_870 = *puVar9;
                  puVar9 = puVar9 + 2;
                  uVar8 = uVar8 - 1;
                  puVar6 = puVar6 + 2;
                } while (uVar8 != 0);
                local_9a8 = local_9a8 & 0xfffffff0;
0xc709c
      local_2a0 = param_1;
      puStack664 = param_2;
      do {
        uVar19 = puStack664[1];
        uVar16 = *puStack664;
        local_2a8 = local_2a8 - 4;
        uVar17 = (undefined)((ulong)uVar16 >> 0x20);
        uVar8 = (ulong)CONCAT16((char)((ulong)uVar16 >> 0x28),
                                (uint6)((uint)(CONCAT12(uVar17,(short)uVar16) & 0xff00ff) << 0x18 |
                                       (uint)(byte)((ulong)uVar16 >> 8) << 0x10));
        uVar9 = (ulong)CONCAT16((char)((ulong)uVar19 >> 0x28),
                                (uint6)CONCAT11((char)uVar19,(char)((ulong)uVar19 >> 8)) << 0x10);
        uVar15 = CONCAT15((char)((ulong)uVar16 >> 0x30),
                          (uint5)CONCAT12((char)(uVar8 >> 0x18),
                                          CONCAT11((char)(uVar8 >> 0x10),
                                                   (char)((ulong)uVar16 >> 0x10))) << 8);
        uVar8 = (ulong)CONCAT16((char)(uVar8 >> 0x30),uVar15);
        uVar18 = CONCAT15((char)((ulong)uVar19 >> 0x30),
                          (uint5)CONCAT12((char)(uVar9 >> 0x18),
                                          CONCAT11((char)(uVar9 >> 0x10),
                                                   (char)((ulong)uVar19 >> 0x10))) << 8);
        uVar9 = (ulong)CONCAT16((char)(uVar9 >> 0x30),uVar18);
        local_2a0[1] = ((ulong)CONCAT41((uint)(byte)((ulong)uVar19 >> 0x20) << 0x18,(char)uVar19) &
                       0xffffffff00) << 0x18 |
                       (ulong)CONCAT16((char)((uVar9 & 0xffffffff00000000) >> 0x30),
                                       CONCAT15((char)((uVar9 & 0xffffffff00000000) >> 0x28),
                                                CONCAT14((char)((ulong)uVar19 >> 0x38),
                                                         CONCAT13((char)(uVar9 >> 0x18),
0xc792C
  if ((param_1 != (uint *)0x0 && param_2 != (undefined *)0x0) && param_3 != (uint *)0x0) {
    uVar9 = (param_3[3] & 0xff00ff00) >> 8 | (param_3[3] & 0xff00ff) << 8;
    uVar9 = (uVar9 >> 0x10 | uVar9 << 0x10) ^ param_1[3];
    local_d0 = param_1 + 0x24;
    uVar10 = (*param_3 & 0xff00ff00) >> 8 | (*param_3 & 0xff00ff) << 8;
    uVar10 = (uVar10 >> 0x10 | uVar10 << 0x10) ^ *param_1;
    uVar11 = (param_3[1] & 0xff00ff00) >> 8 | (param_3[1] & 0xff00ff) << 8;
    uVar11 = (uVar11 >> 0x10 | uVar11 << 0x10) ^ param_1[1];
    uVar12 = (param_3[2] & 0xff00ff00) >> 8 | (param_3[2] & 0xff00ff) << 8;
    uVar12 = (uVar12 >> 0x10 | uVar12 << 0x10) ^ param_1[2];
    uVar14 = *(uint *)(&DAT_002bca7c + (ulong)(uVar10 >> 0x18) * 4) ^ param_1[4] ^
             *(uint *)(&DAT_002bce7c + (ulong)(uVar11 >> 0x10 & 0xff) * 4) ^
             *(uint *)(&DAT_002bd27c + (ulong)(uVar12 >> 8 & 0xff) * 4) ^
             *(uint *)(&DAT_002bd67c + (ulong)(uVar9 & 0xff) * 4);
    uVar1 = *(uint *)(&DAT_002bca7c + (ulong)(uVar12 >> 0x18) * 4) ^ param_1[6] ^
            *(uint *)(&DAT_002bce7c + (ulong)(uVar9 >> 0x10 & 0xff) * 4) ^
            *(uint *)(&DAT_002bd27c + (ulong)(uVar10 >> 8 & 0xff) * 4) ^
            *(uint *)(&DAT_002bd67c + (ulong)(uVar11 & 0xff) * 4);
    uVar2 = *(uint *)(&DAT_002bca7c + (ulong)(uVar11 >> 0x18) * 4) ^ param_1[5] ^
            *(uint *)(&DAT_002bce7c + (ulong)(uVar12 >> 0x10 & 0xff) * 4) ^
            *(uint *)(&DAT_002bd27c + (ulong)(uVar9 >> 8 & 0xff) * 4) ^
            *(uint *)(&DAT_002bd67c + (ulong)(uVar10 & 0xff) * 4);
    uVar9 = *(uint *)(&DAT_002bca7c + (ulong)(uVar9 >> 0x18) * 4) ^ param_1[7] ^
            *(uint *)(&DAT_002bce7c + (ulong)(uVar10 >> 0x10 & 0xff) * 4) ^
            *(uint *)(&DAT_002bd27c + (ulong)(uVar11 >> 8 & 0xff) * 4) ^
            *(uint *)(&DAT_002bd67c + (ulong)(uVar12 & 0xff) * 4);
That’s the whole flow. A trace tool like this, combined with the constant-expression de-obfuscation tricks above, gets you from “where is the protected algorithm?” to “here are the calls that matter” quickly enough to keep going. The static decompiler does the heavy lifting on structure; Stalker does the heavy lifting on dynamics.
Colin Xiao — I take on contract reverse-engineering work, and writeups like this are how I show what I can do. If you need help with anything in this space — including but not limited to the areas I cover above — I’m available. No project is too big or too small — if it’s reverse engineering and I can do it, I’ll take it. DM me on X (@colinxiao_lab) or Telegram (@ColinXiao666).
Get in touch